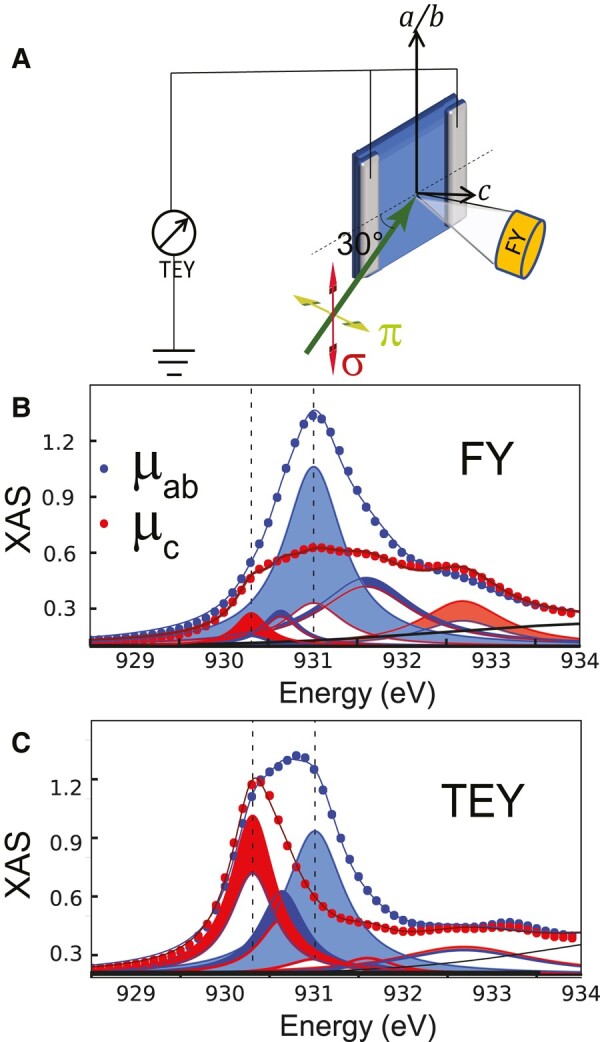
Fig. 1.

XAS data showing the charge transfer and orbital reconstruction effects of the interfacial CuO2 layer. A) Schematics of the XAS experiment in FY and TEY modes. B and C) FY and TEY spectra and multipeak fits for the in-plane and out-of-plane components of the linearly polarized incident X-rays. Blue (red) shaded areas denote contributions with ( (<0), where () is the net absorption along the in-plane (out-of-plane) direction, as explained in Section S1.1. (40).
