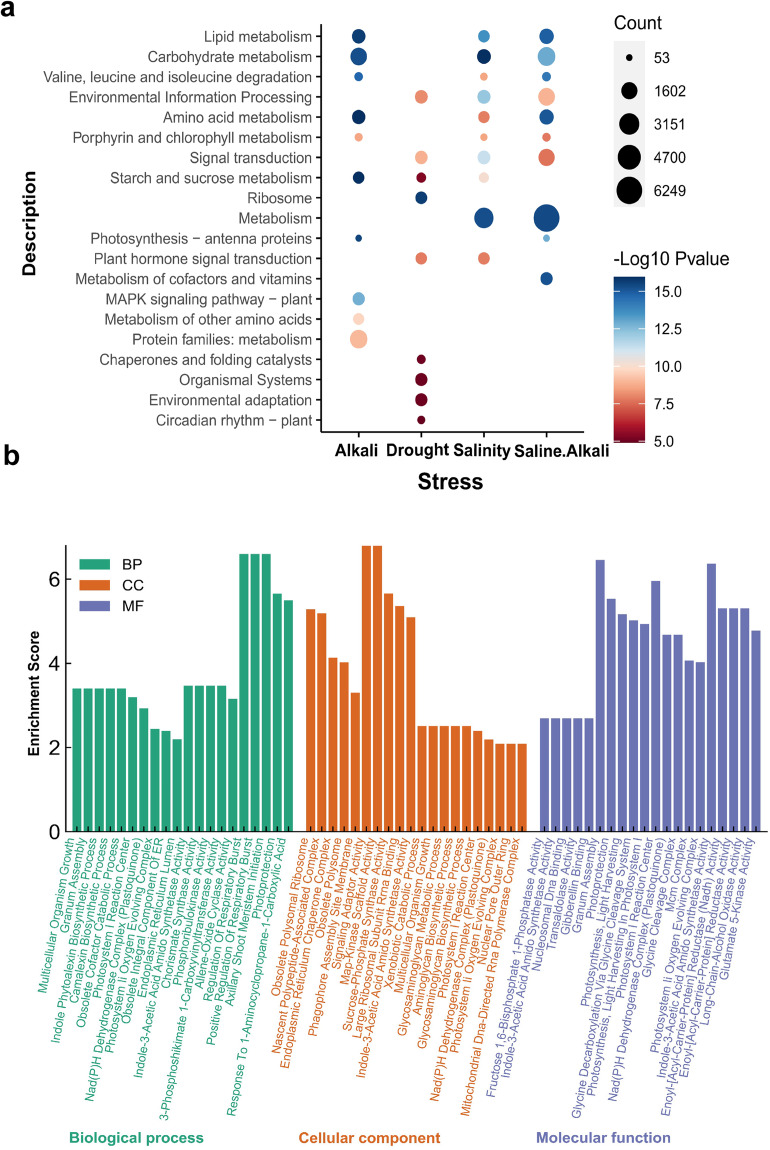
Fig. 5.
Enrichment analysis of DEGs of alkali, drought, salinity and saline-alkali stress stresses. (a) KEGG analysis of differentially expressed genes (DEGs) in terms of Metabolism, Organismal Systems, Genetic Information Processing, and Environmental Information Processing. The term Count displays the count of genes that are linked with every KEGG term. The intensity of blue color indicates the highest, while that of red color shows the lowest negative log10 P value; (b) Gene ontology identifying cellular components, molecular functions and biological processes. The left side of the display shows the percentage of genes associated with each ontology term, while the right side demonstrates the percentage of genes in the dataset that are associated with that term. (Preferably placed before Usage Notes).

