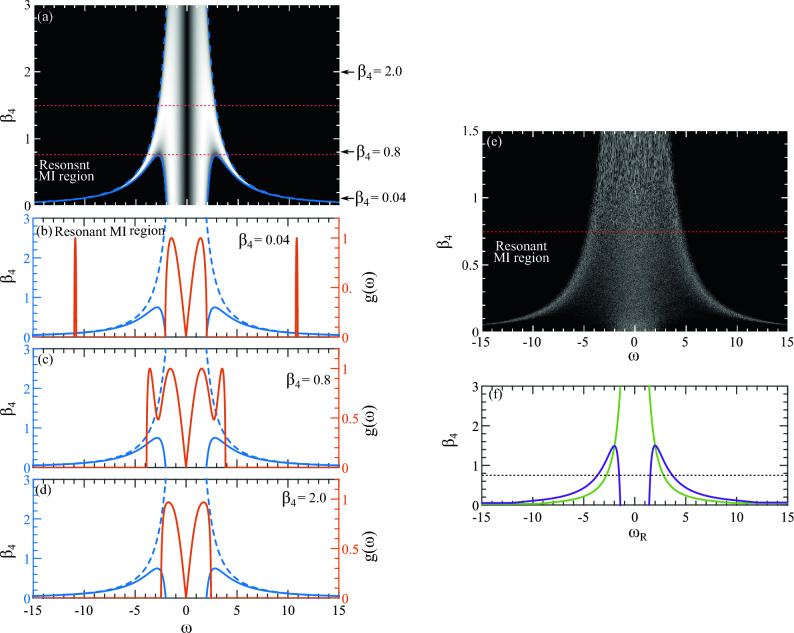
Figure 1.
The relationship between the coefficient and the MI frequency is examined under different conditions. In (a), the MI frequency range is depicted for all , with . The bright region indicates the presence of MI, while the dark region represents its absence. Three distinct MI regions are identified and separated by red-dotted lines. (b) Illustrates the MI band within the resonance MI region with a solid brick-red curve for , denoted by a black arrow in (a). Similarly, (c) shows the region of MI where two MI frequencies are within the same MI band, and (d) shows the MI band with one MI frequency only, with the corresponding positions highlighted in (a) using black arrows. The right Y-axis represents the growth rate , and the blue curves (Eq. 1) represent the upper (dashed) and lower (solid) boundaries on the plane where MI occurs. The left Y-axis displays . (e) Similar to (a) but numerically generated using a white noisy initial condition (Eq. 2). (f) Presents only those modulation frequencies with the highest gain, based on Eqs. (3) and (4), depicted by purple and green curves. Below the dotted black line marks the resonant MI regimes (please see the Supplementary Material to see the impact where a movie is also provided with varying vs ).

