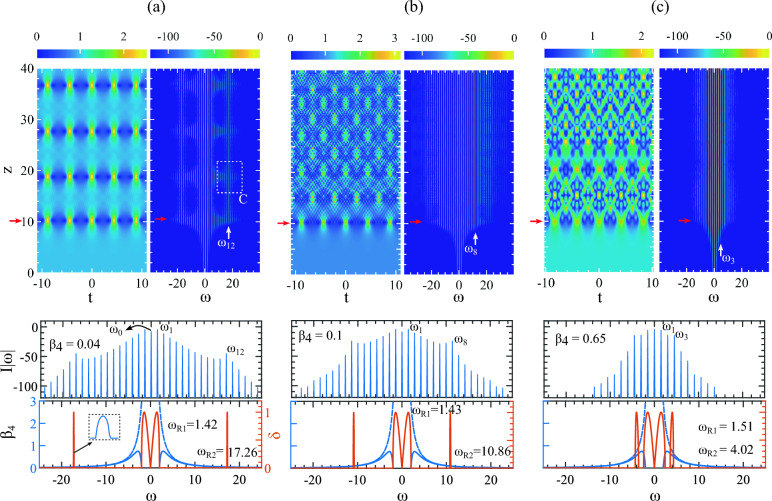
Figure 2.
Impacts of on an AB in the resonant MI region. In each case (a–c), the top-panel shows the temporal and spectral evolution while the mid-panel shows the resonant amplification of the harmonics of the AB’s discrete spectrum. The bottom-panel shows the movements of the MI band compared to its region boundary. The discrete spectrums are taken at AB’s first compression points indicated by the red arrows with the values of (a) , (b) , and (c) . In each case, the MI frequency excites the first harmonic and excites the phase-matched harmonics in (a) , (b) and (c) .

