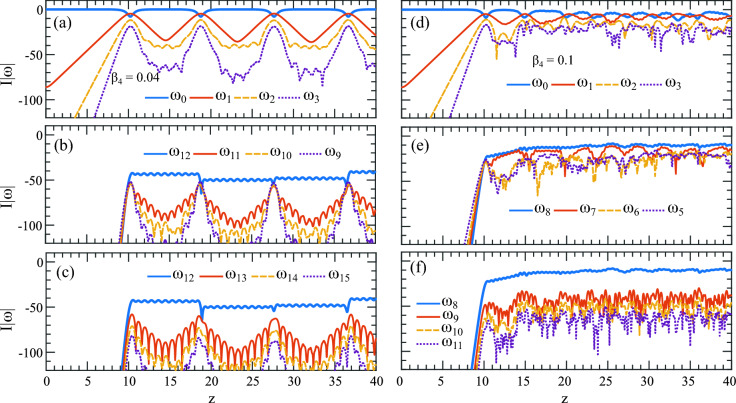
Figure 5.
Evolution and energy interaction plots along for the pump and its next three harmonics from Fig. 4a, b. The top blue curve in all examples represents the pump. (a) Pump exhibits energy exchange with neighboring sidebands while maintaining recurrence behavior along . (b) The harmonic , excited at the resonant frequency , now acts as a pump (marked by the white arrow in Fig. 4a), interacting with sidebands originating from its left side. Similarly, (c) illustrates the evolution of three sidebands on the right of . (d) Shows the evolution of the first three sidebands in Fig. 4b next to the pump with , revealing energy exchange. (e) Displays the interaction of harmonic indicated by the white arrow as the pump with sidebands situated on its left. Similarly, (f) shows the interaction of sidebands with on the right.

