Figure 7.
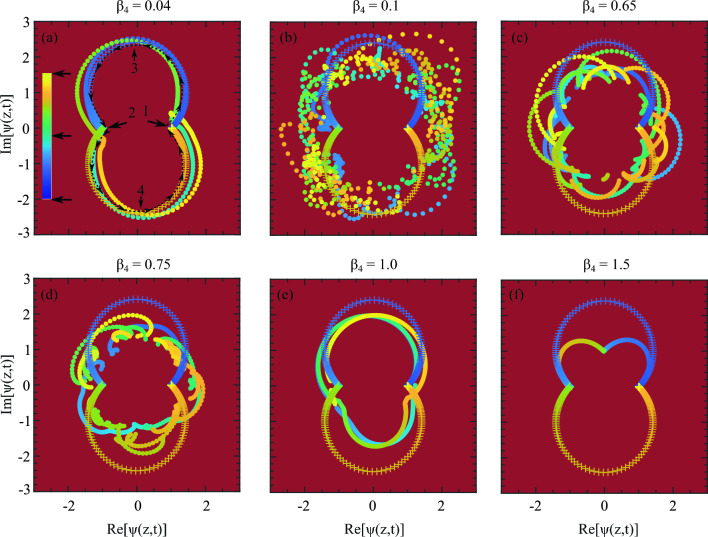
The trajectory of the ABs recurrence cycles on a complex plain. An ideal AB trajectory is presented with marker in each from (a–f). The beginning of the AB’s amplitude development starts following the dark-blue which is at the bottom arrow on the colorbar. This point is indicated by the black arrow 1 inside the upper-trajectory loop and the journey ends after one growth-return cycle at the middle arrow on the colorbar. This position is indicated by the black arrow 2 inside the loop. The beginning of the second growth-return cycle starts again at arrow 2 but follows the downward loop and ends at arrow 1 again taking the color bright yellow at the top of the colorbar. The top row shows for (a) , (b) , and (c) where the bottom row is with (d) , (e) and (f) . Provided Supplementary Material also highlights these dynamics.

