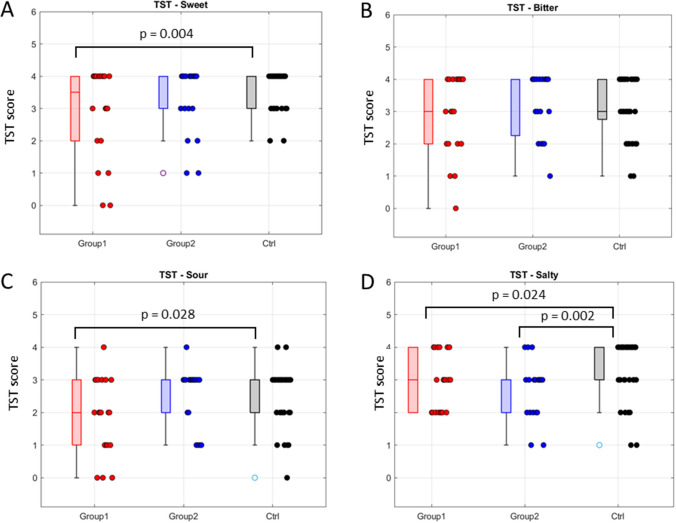
Fig. 4.
Comparison of the Taste Strips Test (TST) individual scores, for each taste quality assessed, among groups: Group 1, Group 2, and the healthy control one (Ctrl). Sweet (A), bitter (B), sour (C), and salty (D). p-values from Wilcoxon matched-pairs signed-rank tests (p-values > 0.05 are not reported). For sweet, sour, and salty, a significant difference emerged between Group 1 and Ctrl (p = 0.004, p = 0.028, and p = 0.024, respectively). In addition, for salty taste also Group 2 showed a significant difference with Ctrl (p = 0.002)

