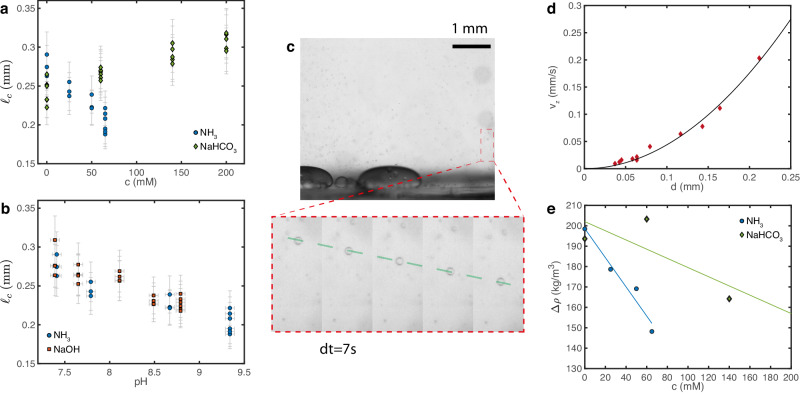
Fig. 7. Interfacial tension measurment.
a, b Capillary length ℓc as a function of solute concentration c and pH for NH3 (aq), NaHCO3 and NaOH. Each point represents a measurement on one droplet. Error bars convey non-statistical measurement uncertainties that account for the accuracy of the measuring instruments and measuring procedure (see text for details) c Snapshot of a movie looking at the sedimentation of small drops. Scale bar 1 mm, PEGDA 12k coating. The inset shows an image sequence zoomed on a single drop (dt = 7 s). The drop has reached a constant velocity as shown by the dashed line. d Terminal velocity vz as a function of the drop diameter d. The solid curve is a quadratic fit vz = Ad2, from which we extract the density difference, Δρ. e Density difference Δρ as a function of solute concentration c for NH3 (aq) and NaHCO3. The solid lines are linear fits that we use to compute γ, the distance to the fitted lines is our measurement error δ(Δρ). Source data for (a, b, d, e) are provided as a Source Data file.

