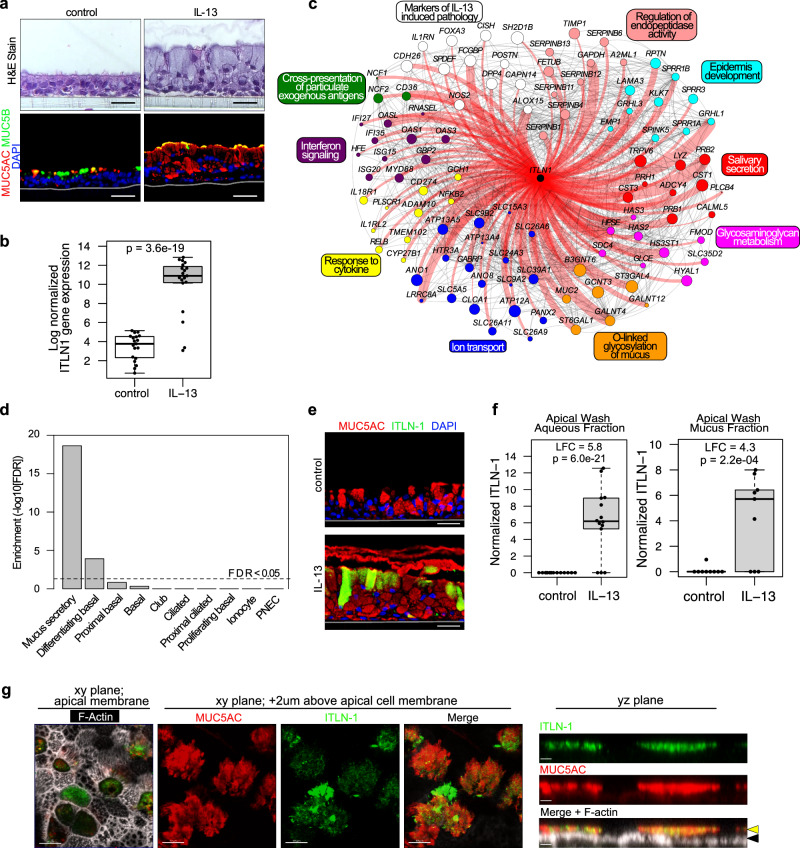
Fig. 1. ITLN-1 is an IL-13-induced component of the airway epithelium.
a Chronic IL-13 stimulation model of airway epithelial T2 inflammation as illustrated by H&E staining and immunofluorescent (IF) labeling of MUC5AC (red), MUC5B (green), and nuclei (blue); images are representative of 8 paired donors analyzed; scale bar 30 µM. b Box plot of normalized ITLN1 gene expression in baseline (control) and IL-13-treated ALI cultures (n = 19 donors). FDR-adjusted (Benjamini-Hochberg method) two-sided p value is based on a paired exact test (edgeR). Box centers = median, upper and lower box bounds = 1st and 3rd quartiles, whiskers extend from these bounds up to 1.5 × IQR (inter-quartile range), and data beyond whiskers are plotted as points. c Connectivity among genes within a co-expression network that includes ITLN1. Genes shown are those annotated for the enriched functional terms and pathways indicated. Genes with direct connections to ITLN1 are highlighted in red and edge width indicates strength of connectivity. Node color denotes functional annotation, and node size increases with eigengene-based connectivity to the network. d Enrichment of ITLN1 co-expression network genes in mucus secretory cells, compared to all other defined airway epithelial lung cell populations identified by scRNA-seq. FDR-adjusted two-sided p-values are based on a one-sided hypergeometric test. e Immunofluorescent labeling shows IL-13-induced expression of ITLN-1 in a subset of MUC5AC+ secretory cells; MUC5AC (red), ITLN-1 (green), nuclei (blue); Images are representative of 8 paired donors analyzed; scale bar 30 µM. f Boxplots of normalized ITLN-1 peptides measured in apical ALI secretions following control and chronic IL-13 stimulation (aqueous fraction n = 14 donors, mucus fraction n = 9 donors). FDR-adjusted two-sided p values are based on a paired exact test (edgeR). LFC = log fold change. Box plots as defined in b. g Confocal imaging analysis of mucociliary ALI cultures stimulated with IL-13 illustrating ITLN-1 presence within the airway mucus on the apical side of mucociliary epithelium; MUC5AC (red), ITLN-1 (green), F-actin (white); black arrows—apical cell membrane, yellow arrows—mucus layer; XY image scale bar 10 µm; YZ image scale bar 2.5 µm; images are representative of ALI cultures labeled from n = 3 HBEC donors. Source data are provided as a Source Data file.

