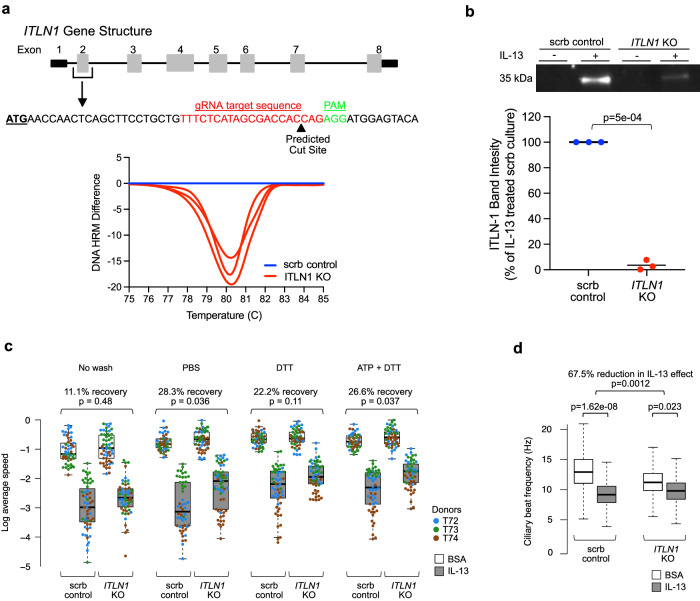
Fig. 2. ITLN-1 contributes to IL-13-mediated decrease in epithelial mucociliary function.
a Schematic of the gene structure of ITLN1, the targeted CRISPR-Cas9 editing site, and the resultant DNA editing as determined by high-resolution melt curve analysis. The plot (bottom) shows differences in melt temperature profiles from pooled ALI inserts (n = 3/condition) for ITLN1 KO (red) samples from each donor assayed by HRM analysis. The scramble control DNA melt temperature profile (blue) was set as the reference for each donor (n = 3 donors). b Western blot quantitation of ITLN-1 (35 kDa) in apical washes collected from mock or IL-13-stimulated mucociliary ALI cultures differentiated from control edited (scrb; blue) and ITLN1 KO basal cells (red); Western blot image is representative of all measured data, and band intensity plot reflects data from conditions from all edited donors (n = 3); Two-sided p values calculated using paired Student’s t test. c Box plots showing the log of average particle speed within control edited (scrb) and ITLN1 KO mucociliary cultures that were mock- (BSA, white boxes) or IL-13-stimulated (gray boxes), with replicate experiments carried out using no wash, PBS wash, PBS-DTT wash, and ATP + PBS-DTT wash regimes. Data values represent the log of average speed of all measured particles within each video from the MCM assays, where there are an average of n = 18 videos for each of the 16 total conditions (2 gene-edited statuses × 2 treatments × 4 washes) per donor. Videos were captured across 6–7 fields of view across the culture to account for variation across the culture, measured across n = 3 individual ALI inserts from each of the edited donors (n = 3)—with each donor identified by a different color in the plot). The exact sample sizes per box, left to right, are 54, 55, 56, 55, 55, 54, 58, 58, 55, 55, 55, 56, 56, 54, 55, 58. Above plots are given the estimated percent recovery (and associated p values) of particle speed in IL-13-stimulated cultures relative to BSA cultures when in an ITLN1 KO epithelium compared to the control (scrb) epithelium. Two-sided p values are based on linear mixed model t tests, with random effects for donor and insert, and use Satterthwaite approximation of degrees of freedom. Box centers = median, upper and lower box bounds = 1st and 3rd quartiles, whiskers extend from these bounds up to 1.5 × IQR (inter-quartile range). All data points are overlain. d Box plots of ciliary beat frequency (CBF) measured on control (scrb) and ITLN1 KO mucociliary ALI cultures from triplicate culture inserts and 3 donors following mock- and IL-13-stimulation. Each box plot, as defined in c, represents all datapoints collected from all videos captured across donors and inserts for each condition (n = 30,899, 24,786, 25,533, and 24,964, from left to right), but illustration of outliers was excluded for visualization purposes. Two-sided p values are based on linear mixed model t-tests with random effects for donor and insert and use Satterthwaite approximation of degrees of freedom. Source data are provided as a Source Data file.

