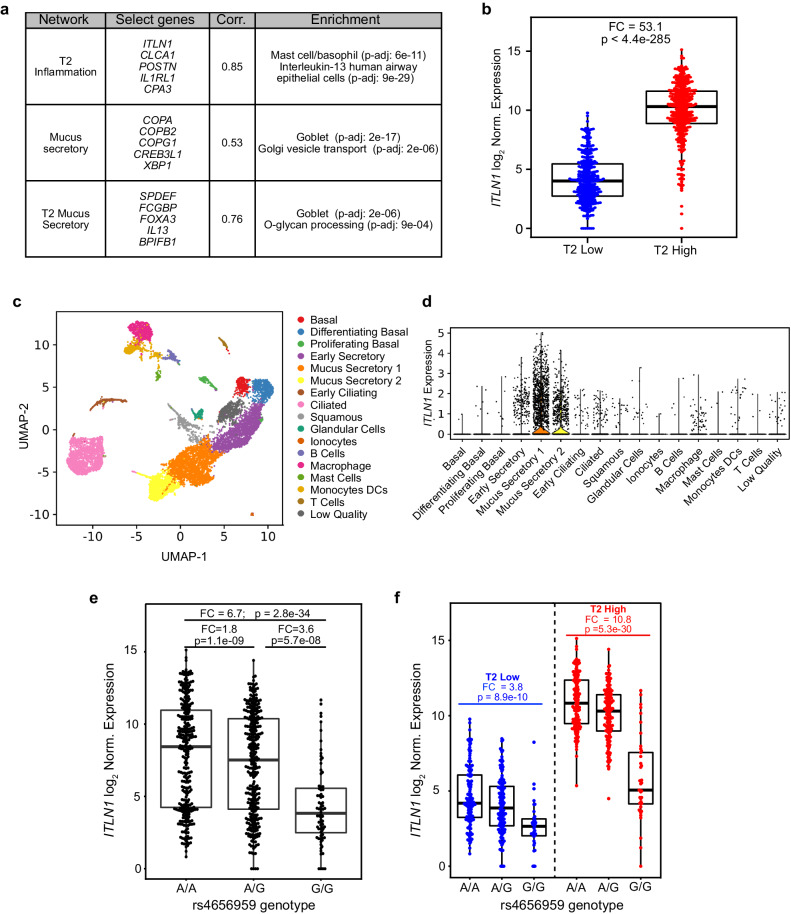
Fig. 4. ITLN1 is correlated with T2 inflammatory mucus secretory expression networks and is expressed by mucus secretory cells in vivo.
a WGCNA conducted using gene expression from nasal airway epithelial brushings collected from 695 children in the GALA II asthma study found a strong correlation of ITLN1 expression with T2 inflammation and mucus secretory networks. Select genes from each network, Pearson correlation between expression of ITLN1 and network eigengenes, and top functional enrichments from each network are given. Enrichment p values were obtained from a one-sided Fisher exact test implemented in Enrichr. FDR-adjusted p values were obtained using the Benjamini–Hochberg method. b Box plots of log2-normalized ITLN1 gene expression in GALA II nasal epithelial brushes stratified by T2 inflammation status (n: T2-low = 331, T2-high = 364). Fold change (FC) and two-sided p value from a Wald test was obtained from DESeq2. Box centers = median, upper and lower box bounds = 1st and 3rd quartiles, whiskers extend from these bounds up to 1.5 × IQR (inter-quartile range). All data points are overlain. c UMAP visualization of 11,515 cells from scRNA-seq of two dissociated bronchial airway epithelial brushings detailing the 17 cell types identified by SNN clustering through the Leiden algorithm. d Violin plots of log count per million (CPM)-normalized ITLN1 expression across the 17 distinct cell types identified in bronchial airway brushings. e Box plots of log2-normalized ITLN1 expression in GALA II stratified by the A/A (n = 292), A/G (n = 313), or G/G (n = 76) genotypes of the top eQTL variant rs4656959. Two-sided p-values were obtained from a Wald test in DESeq2. Box plots as defined in b. f Box plots of log2-normalized ITLN1 expression in GALA II, stratified by T2 inflammation status and the genotypes of the top eQTL variant rs4656959 (T2-low n: A/A = 141, A/G = 148, G/G = 35 and T2-high n: A/A = 151, A/G = 165, G/G = 41). Two-sided p values were obtained from a Wald test in DESeq2. Box plots as defined in b. Source data are provided as a Source Data file.

