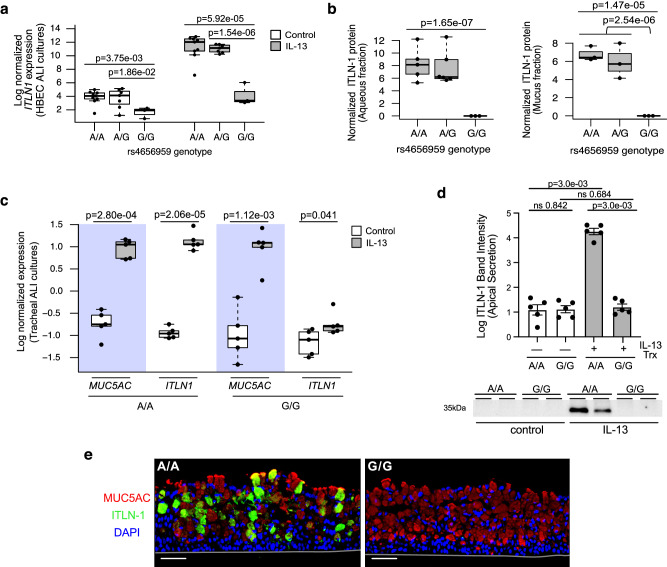
Fig. 5. ITLN1 rs4656959 variant eliminates ITLN-1 protein expression in airway epithelia.
a Normalized ITLN1 gene expression from paired HBEC ALI cultures (n = 19 donors) stratified by treatment (control vs. IL-13) and by ITLN1 rs4656959 genotype for both treatments (n: A/A = 9, A/G = 7, and G/G = 3). Two-sided p values for indicated differences are based on an exact test (edgeR). Box centers = median, upper and lower box bounds = 1st and 3rd quartiles, whiskers extend from these bounds up to 1.5 × IQR (inter-quartile range). All data points are overlain. b Box plots showing normalized ITLN-1 protein secretion measured in aqueous (left; n: A/A = 5, A/G = 6, and G/G = 3) and mucus (right; n: A/A = 3, A/G = 3, and G/G = 3) fractions from apical washes of IL-13-stimulated HBEC ALI cultures. Two-sided p values are based on an exact test (edgeR). Box plots as defined in a. c Normalized ITLN1 and MUC5AC expression measured by qPCR from tracheal mucociliary ALI cultures stratified by treatment (control-white or IL-13-gray) and by ITLN1 rs4656959 genotype (n = 5 donors/genotype). Two-sided p-values are based on linear mixed model t tests with donor as random intercept using Satterthwaite approximation of degrees of freedom. Box plots as defined in a. d Western blot analysis measuring ITLN-1 in apical washes from control or IL-13-stimulated tracheal ALI cultures with the A/A or G/G genotype of rs4656959 (n = 5 donors/genotype). Western blot image is representative of data from all donors. Band intensity data reflect all conditions from all donors (n = 5 donors/genotype). Data represent mean value ± SEM; Two-sided p values calculated using Student’s t test. e Immunofluorescent labeling of IL-13-treated tracheal ALI cultures for ITLN-1 (green), MUC5AC (red), and nuclei (DAPI); images are representative of all 10 donors analyzed; scale bar 50 μm. Source data are provided as a Source Data file.

