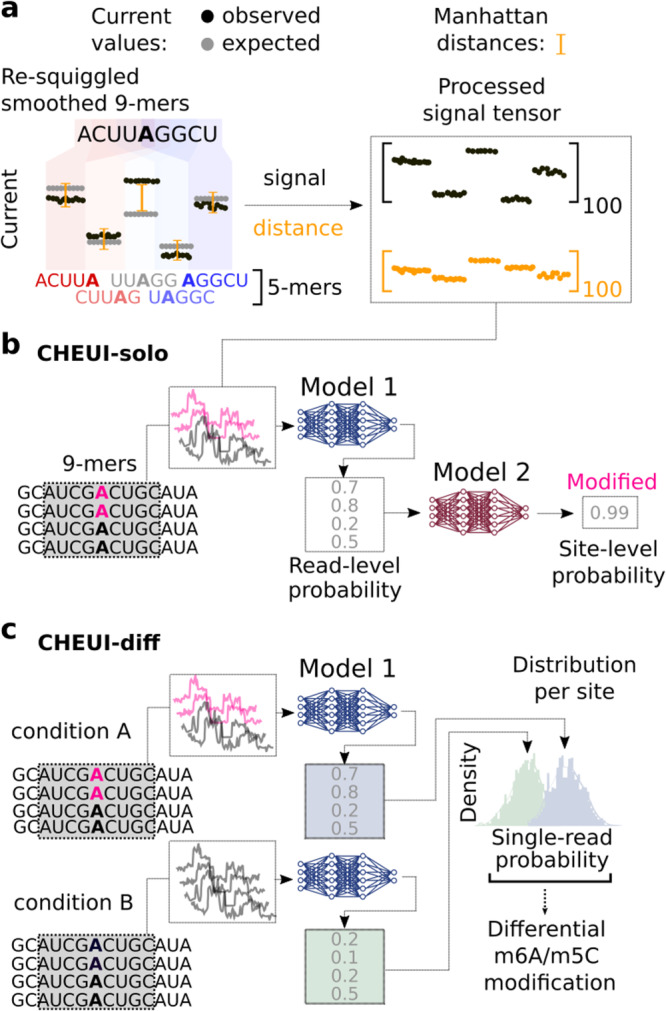
Fig. 1. CHEUI architecture, modules, and signal processing approach.

a CHEUI first processes signals for each 9 mer consisting of five consecutive overlapping 5 mers. The signals for each 5 mer are converted into 20 median values, yielding a vector of length 100. A vector of length 100 is obtained for the expected (unmodified) signals for the same five 5 mers and a vector of distances between the expected and observed signal values is calculated. These signal and distance vectors are used as inputs for Model 1. b CHEUI-solo Model 1 takes the signal and distance vectors corresponding to individual read signals associated with a 9 mer centered at every A (indicated as modified in pink, or unmodified in black) or C, and predicts the probability for each read of being modified A (m6A model) or modified C (m5C model). Model 2 uses the distribution of Model 1 probabilities for all the read signals at each reference transcript site and predicts the probability of the site being methylated and its stoichiometry, which estimated as the proportion of modified reads from Model 1 at that site. c CHEUI-diff uses the individual read probabilities from Model 1 in any two conditions to test for differential m6A or m5C at reference transcript sites using a two-tailed Mann–Whitney U-test.
