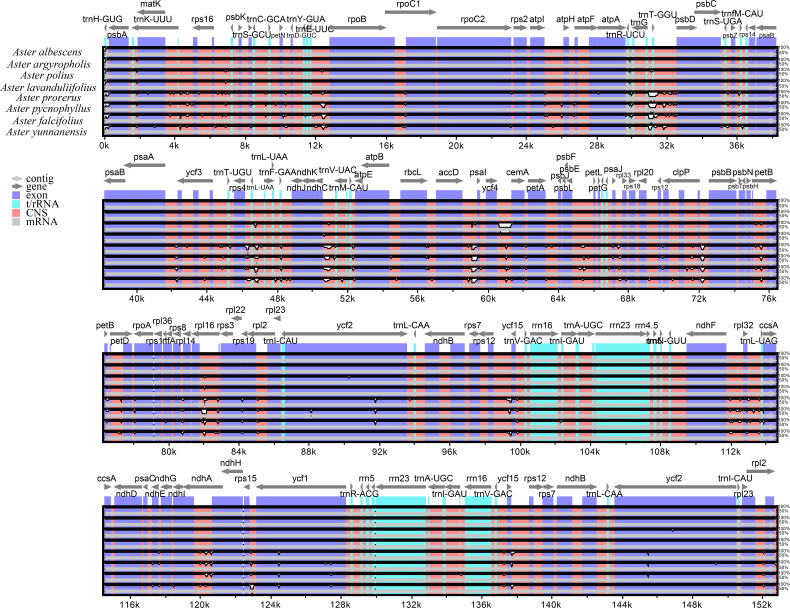
Figure 5.
Comparison of the chloroplast genome of the eight Aster newly sequenced species. Dark blue bars represent protein-coding genes, pale blue bars represent rRNA genes, and red bars represent conserved non-coding sequences. The y-scale axis represents the percentage identity (50%–100%). mVISTA was used to perform the comparison.

