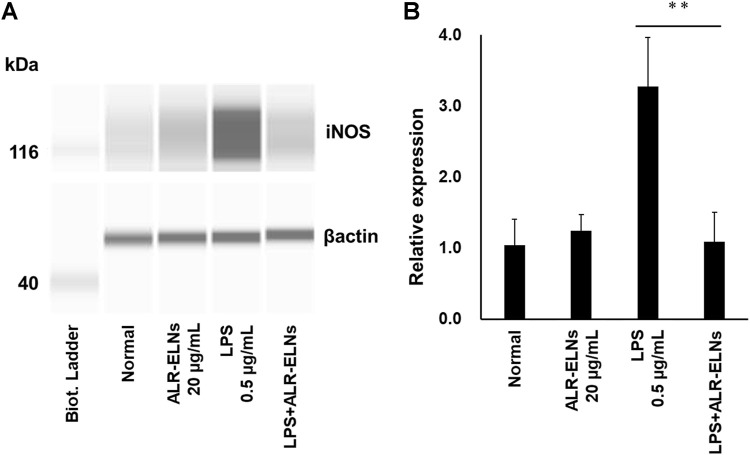
FIGURE 7.
Effects of ALR-ELNs on LPS-induced levels of iNOS in BV-2 cells. The cells were pretreated with 20 μg/mL ALR-ELNs for 3 h and stimulated with 0.5 μg/mL LPS for 12 h. (A) Western blotting analysis of iNOS levels. Expression of β-actin served as loading control. (B) Densitometric analysis of (A). Values are expressed as mean ± SD. F 3,12 = 22.5, **p < 0.01 vs. LPS treatment alone by one-way ANOVA followed by Tukey’s test.

