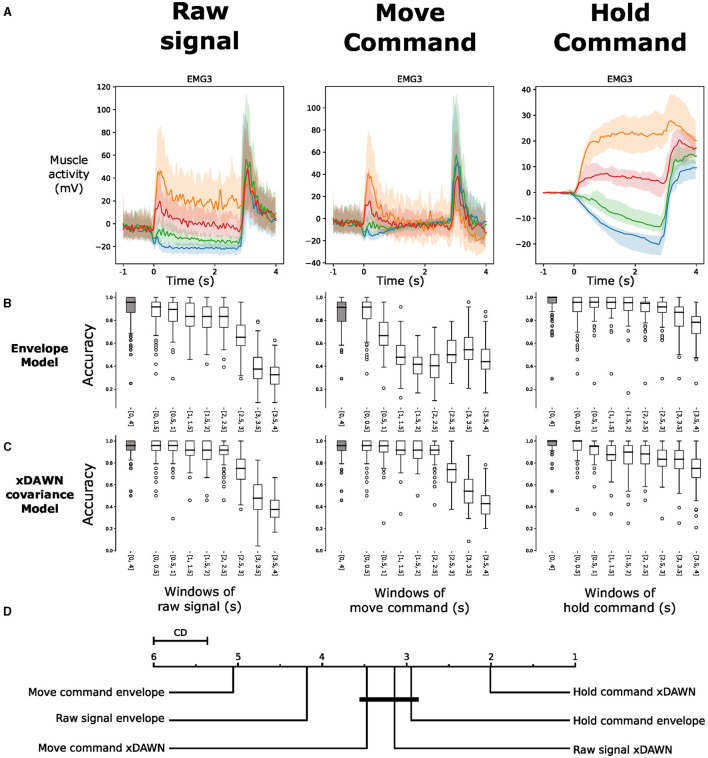
Figure 12.
(A) Visualization of the EMG commands during four hand gestures on different muscles from one subject with a decomposition of the recorded signal into move and hold commands. The colors of the four gestures are similar to those in Figure 7. (B) Box plots of the intra-subject accuracy obtained with a logistic regression model directly on the signal envelope in the different components. (C) Box plots of the intra-subject accuracy obtained with a logistic regression model on the xDAWN covariances matrices from the different components. (D) Average rank of the corresponding classifiers (the lower, the better). Classifiers that are not significantly different are connected by a black line [at p = 0.05 found by a Nemenyi test (Demšar, 2006)]. The critical distance (CD) indicates when classifiers are considered statistically different.

