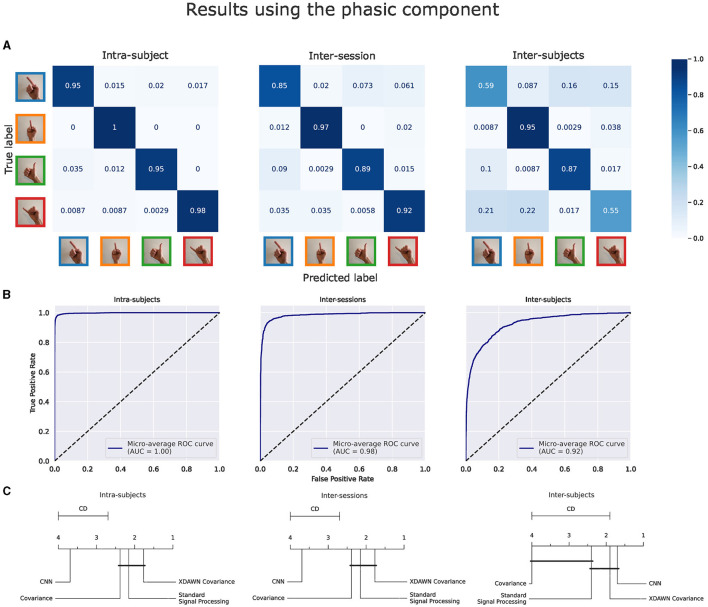
Figure 9.
Results of the voting ensemble of the four classification pipelines using the phasic component of the EMG signals in intra-subject, inter-sessions, and inter-subjects configurations. (A) Confusion matrices. (B) ROC curves. (C) Average rank of the corresponding classifiers (the lower, the better). Classifiers that are not significantly different are connected by a black line [at p = 0.05 found by a Nemenyi test (Demšar, 2006)]. The critical distance (CD) indicates when classifiers are considered statistically different.

