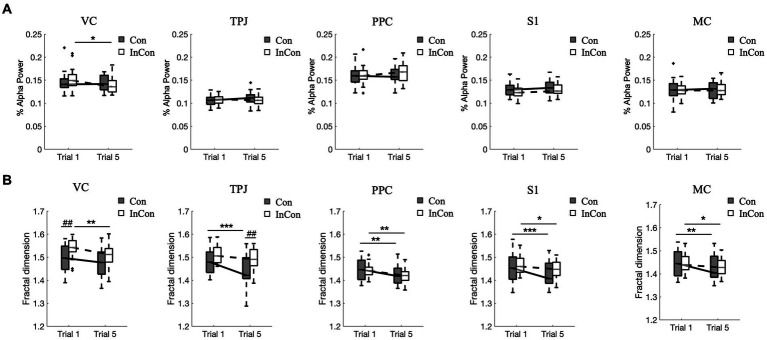
Figure 4.
Changes of normalized alpha power values (A) and fractal dimension values of EEG data (B). In each box plot, the box represents 1st and 3rd quartiles with the median value. The asterisk and the sharp (4) indicate a significant difference (*<0.05, **<0.01, ***<0.001, ##<0.01) between trials and groups, respectively. Con and lnCon represent congruent and incongruent conditions, respectively. MC, motor cortex; PPC, posterior parietal cortex; S1, primary somatosensory; TPJ, temporal-parietal junction; VC, visual cortex.

