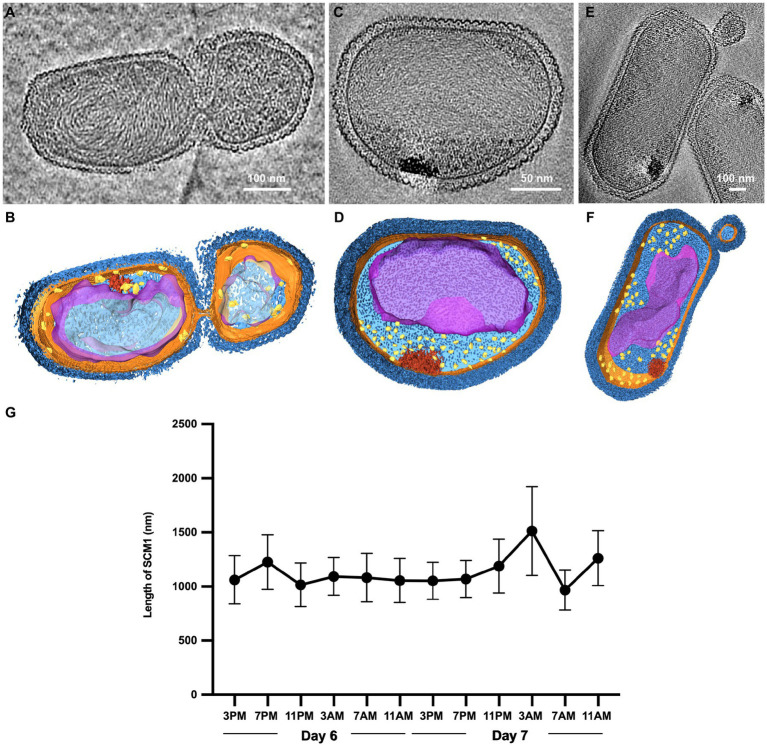
Figure 2.
Observation of cell division in Nitrosopumilus maritimus SCM1. (A,C,E) Tomographic slices (13.6 Å in thickness) of SCM1 cells in the exponential phase. (B,D,F) 3D segmentation of (A,C,E). S-layer (dark blue), cell membrane (orange); cytoplasm (light blue); nucleoid (purple); ribosomes (yellow); high-density region (red). (G) The average length of SCM1 at different time points. SCM1 cells were analyzed every 4 h for 48 h period in the late exponential phase (n = 40).

