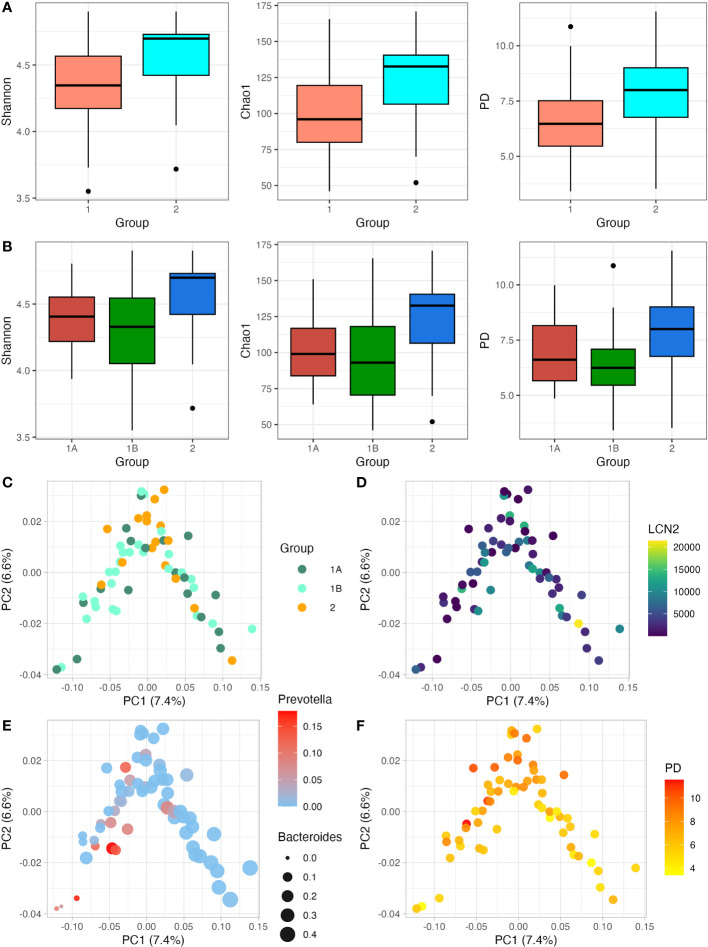
Figure 1.
Relationship between alpha diversity and beta diversity with LCN2 levels and clinical presentation of TD. (A, B); Shannon, Chao1 and Phylogenetic diversity (PD) index were estimated. In (A) participants are divided into two groups (TD and no TD; Group 1 and Group 2); whereas in (B) participants are divided into three groups (Confirmed TD, Probable TD and no TD; Group 1A, Group 1B and Group 2, respectively). (C, D) show the relation between the beta diversity weighted unifrac PCoA and the clinical presentation of TD (C) and LCN2 levels (D); (E, F) show the relation of beta diversity weighted unifrac PCoA with the relative abundance of Pevotella/Bacteroides and alpha diversity expressed as PD, respectively. with weighted unifrac PCoA. Along with the y- and x-axis, the percentage of variance explained by PC1 and PC2 is indicated.

