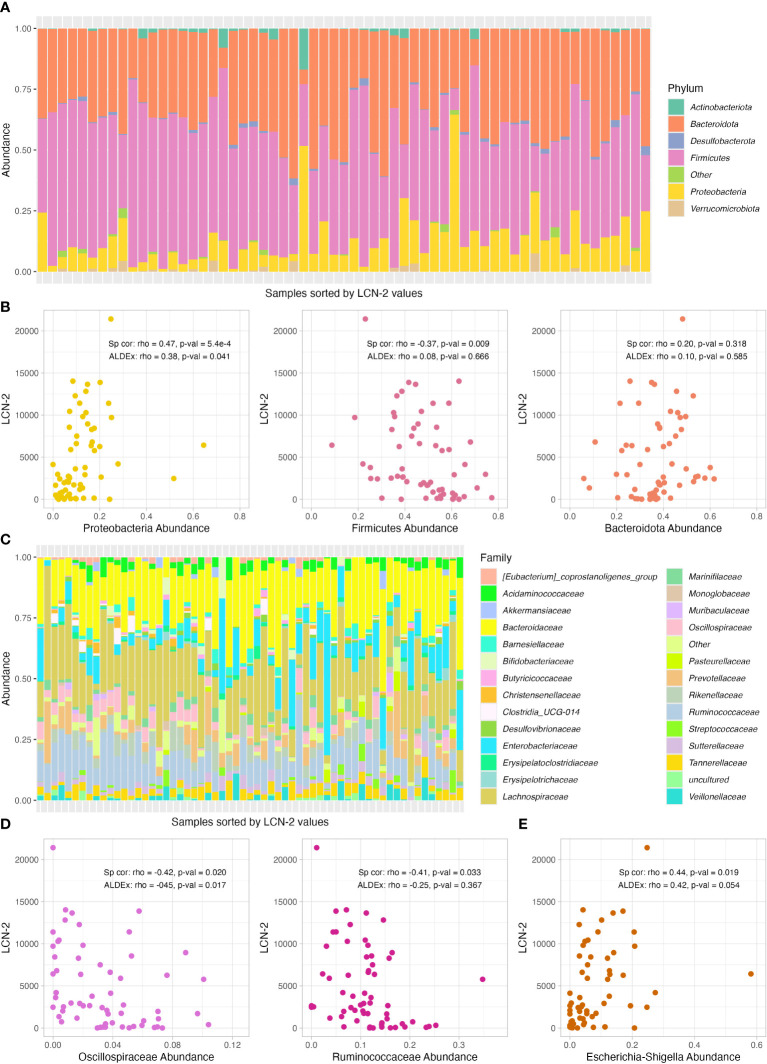
Figure 2.
Relative abundance of bacterial phylum and correlation analysis with LCN2 levels. (A) Relative abundance of bacterial phyla per sample, which are shown sorted by faecal LCN2 levels (lower levels on the left and higher on the right). (B) Scatter plot of the correlation between Bacteroidetes, Firmicutes and Proteobacteria abundance and LCN2 levels. (C) Relative abundance of bacterial family per sample, which are shown sorted by faecal LCN2 levels (lower levels on the left and higher on the right). (D, E) Scatter plots of the correlation between Oscillospiraceae, Ruminococcaceae and Escherichia-Shigella abundance and LCN2 levels. Spearman (Sp cor) and ALDEx correlation coefficient (rho) and p-values are shown in each graph for each taxonomic group.

