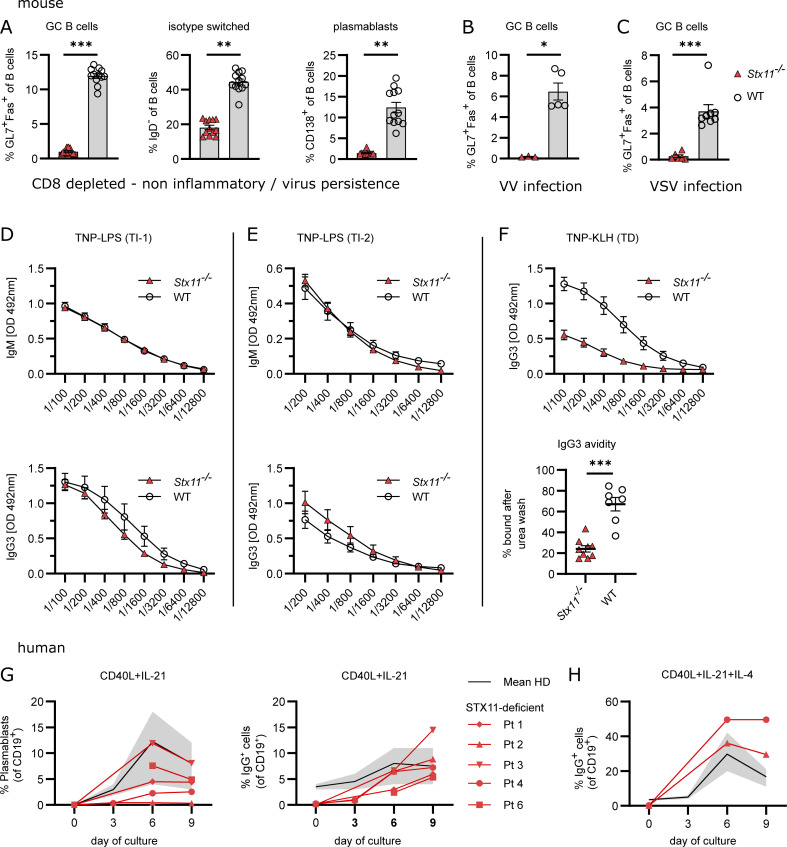
Figure 2.
Impaired B cell responses toward TD antigens in Stx11−/− mice. Mouse: (A) Analysis of B cell differentiation in spleens of CD8-depleted (day −3 and −1) Stx11−/− (n = 12) and WT mice (n = 12: Stx11+/+ n = 6 and C57BL/6N n = 6) d12 p.i. with 200 PFU LCMV-WE (n = 3 independent experiments). (B) Stx11−/− (n = 3) and WT (n = 6: Stx11+/+ n = 1, Stx11+/− n = 2 and C57BL/6N n = 2) infected with 2 × 10⁶ PFU VV i.p.; GC B cells (Fas+GL7+CD19+B220+) in spleen (n = 1 experiment). (C) Stx11−/− (n = 6) and WT (n = 8: Stx11+/+ n = 1, Stx11+/− n = 3, and C57BL/6N n = 4) infected with 2 × 10⁶ PFU VSV i.v.; GC B cells (Fas+GL7+CD19+B220+) in spleen (n = 2 independent experiments). (D and E) IgM (top) and IgG3 (bottom) antibody responses 1 wk after TI immunization with (D) 50 µg TNP-0.5-LPS i.p. Stx11−/− (n = 9) and WT (C57BL/6N n = 6, Stx11+/+ n = 1) (n = 2 independent experiments) or (E) 50 µg TNP-Ficoll i.p. Stx11−/− (n = 7) and WT (Stx11+/+ n = 6) (n = 2 independent experiments). (F) Stx11−/− (n = 9) and WT (C57BL/6N n = 3, Stx11+/+ n = 4) mice immunized with 100 µg TNP-KLH in Sigma-Aldrich Adjuvants System i.p. and 21 days later boosted with 50 µg TNP-KLH in PBS. Serum levels of IgG3 antibodies were measured 1 wk after boost (day 28 after primary immunization) (n = 2 independent experiments) (top). IgG3 avidity measurements (day 28 after primary immunization) (bottom). Relative avidity is reflected by calculation of the area under the curve (AUC) of the titration curve with 8 M urea or and with PBS treatment, respectively (% AUC = AUC+urea/AUC+PBS*100) Stx11−/− (n = 9) and WT (C57BL/6N n = 3, Stx11+/+ n = 4) (n = 2 independent experiments). (G and H) Purified naive human B cells were stimulated with (G) CD40L+IL-21 or (H) CD40L+IL-21+IL-4. Plasmablasts (CD19+CD38+CD27+) and isotype-switched IgG+CD19+ B cell differentiation is shown. The gray area shows the normal range of four healthy donors with mean (black line). (A–H) Mean and ± SEMs of Mann–Whitney U test are shown; *P < 0.05, **P < 0.01, *** P < 0.001, ns indicates not significant.

