Figure 5.
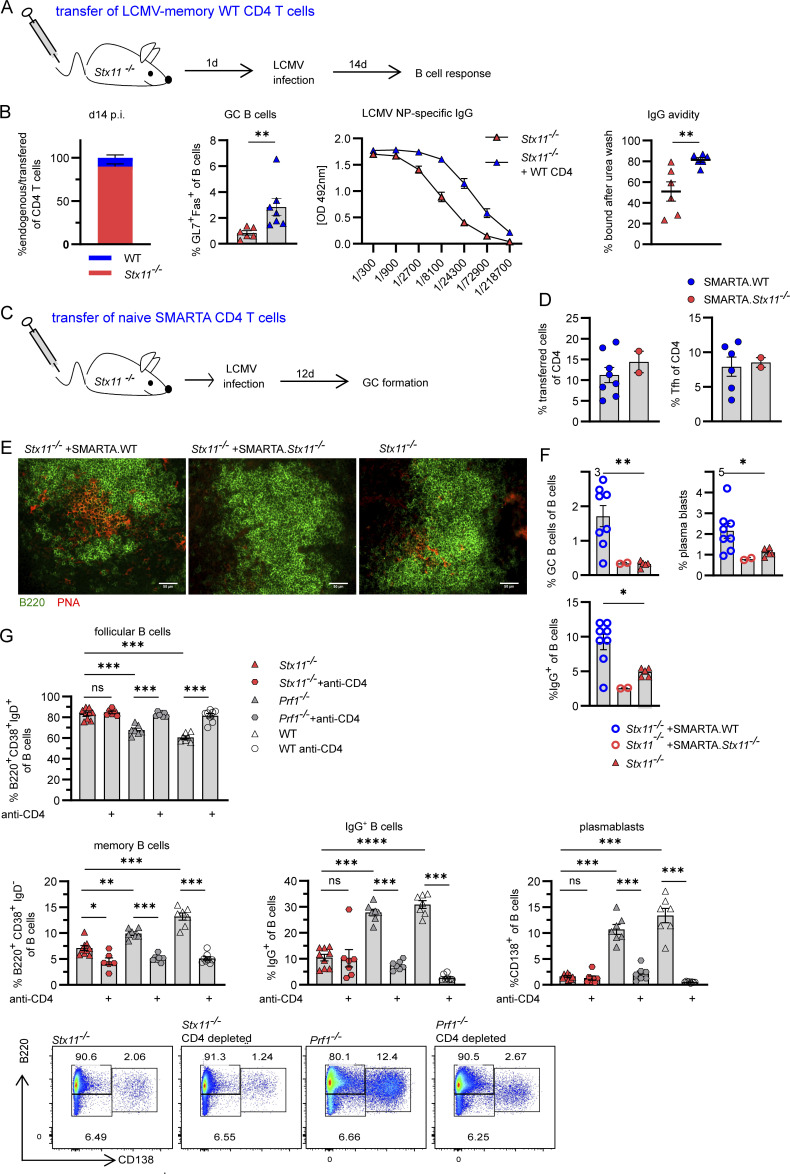
Secondary B cell defect due to limited CD4 T cell help in Stx11 deficiency. (A) Experimental setup for adoptive transfer (AdTf) of WT.CD45.1 (LCMV-memory CD4 T cells) in Stx11−/− mice. On d3 and d1 prior to AdTf, Stx11−/− mice were depleted of CD8 T cells by antibody injection. Stx11−/− mice with AdTf (+ WT.CD45.1 [C57BL/6J] CD4, n = 7) or without (n = 6) were infected with 200 PFU LCMV i.v. (n = 2 independent experiments). (B) Far left: The proportion of transferred CD4 T cells in spleen d14 p.i. Middle left: Percentages of GC B cells (GL7+Fas+ of CD19+B220+). Middle right: LCMV NP-specific IgG in serum quantified by ELISA. Far right: IgG avidity: antigen-captured serum IgG was washed with PBS or 8 M urea. The relative avidity of NP-specific IgG shown as AUC with and without urea treatment (% AUC = AUC+urea/AUC+PBS*100). (C) 106 purified naive SMARTA CD4 T cells were transferred into CD8 T cell–depleted Stx11−/− mice and infected with LCMV and analyzed at d12 p.i. (D) Percentage of transferred SMARTA.WT (n = 8, blue) or SMARTA.Stx11−/− (n = 2, red) CD4 T cells and percentage of SMARTA.WT or SMARTA.Stx11−/− Tfh (CXCR5+PD1+) cells of the CD4 T cell compartment. (E) Representative spleen section showing GC formation after SMARTA.WT transfer: B220 (green), PNA (red) (Stx11−/− n = 4, Stx11−/− +SMARTA.WT n = 4, Stx11−/− +SMARTA.Stx11−/− n = 2 of two independent experiments). Scale bar 50 µm. (F) Percentages of GC (Fas+GL7+), plamablasts (CD138+), and IgG+ B cells of Stx11−/− with SMARTA.WT (blue open circles), SMARTA.Stx11−/− (red open circles), or without transfer (red triangle). (G) B cell differentiation (follicular B cells, memory B cells, IgG+ B cells, and plasmablasts) ± CD4 T cell depletion (day −3 and −1) in Stx11−/− (n = 9 and n = 7 CD4 depleted), Prf1−/− (n = 7 and n = 7 CD4 depleted), and WT (C57BL/6N) mice (n = 8 and n = 7 CD4 depleted) mice after 200 PFU LCMV infection on d12–17 p.i. from n = 2 independent experiments for each group. Bottom: Representative FACS plots showing plasmablast (CD138+) differentiation d12 p.i. (A–G) Mean and ± SEMs of Mann–Whitney U test are shown; *P < 0.05, **P < 0.01, *** P < 0.001, **** < 0.0001, ns indicates not significant.

