Figure 6.
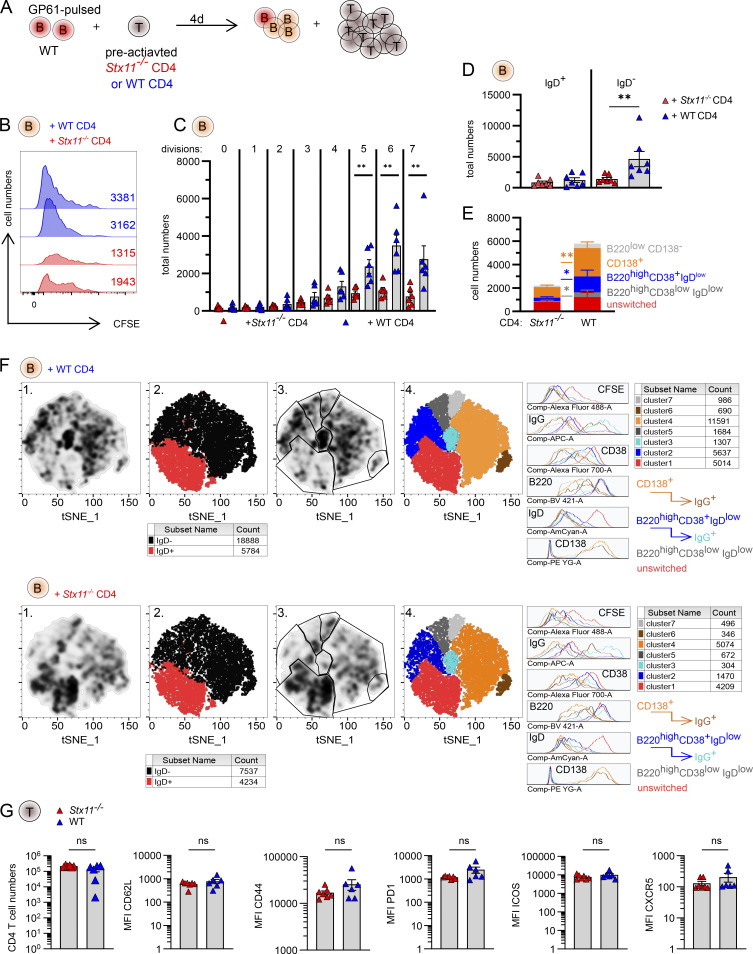
Stx11−/− CD4 T cells are limited to help WT B cells in vitro. (A) Experimental setup of in vitro T/B cell interaction assay with naive, LCMV-GP61-80-pulsed WT (C57BL/6N) B cells incubated with d6 pre-activated SMARTA.WT or SMARTA.Stx11−/− CD4 T cells. (B) Two representative histograms of proliferating (d4 CFSE dilution) WT B cells in coculture with either SMARTA.WT (blue) or SMARTA.Stx11−/− (red) CD4 T cells. (C) Total B cell numbers for different cell divisions (0 = no proliferation; 7 = 7 cell divisions). SMARTA.WT n = 6 and SMARTA.Stx11−/− n = 6 from n = 4 independent experiments. (D) Absolute numbers of unswitched (IgD+) versus isotype-switched (IgD−) B cells on d4 of co-culture of WT B cells with SMARTA.Stx11−/− n = 7 or SMARTA.WT n = 7 from n = 5 independent experiments. (E) Absolute numbers of unswitched B cells (B220highIgD+CD38+CD138−, red), GC-like B cells (B220highIgDlowCD38low, dark gray), memory-like B cells (B220highIgDlowCD38+, blue), and plasmablast-like (CD138+) B cells after co-culture with either SMARTA.Stx11−/− (n = 7) or SMARTA.WT (n = 7) CD4 T cells for 4 days (n = 5 independent experiments). (F) Pooled WT B cells (lymphocytes → single cells → live cells → CD4− B220+) were cocultured with either SMARTA.WT (top, n = 6) or SMARTA.Stx11−/− CD4 T cells (bottom, n = 6) in four independent experiments and analyzed with t-SNE. (1) Density pattern for B cells. (2) Distribution of unswitched (IgD+, red) versus isotype-switched (IgD−, black) B cells. (3) Gating of different clusters according to their density and marker expression patterns. (4) Marker expression of clusters identified: unswitched (IgD+, red), GC-like (B220highIgDlowCD38low, gray), memory-like (B220highIgDlowCD38+, blue), IgG+ memory-like (B220highIgDlowCD38+, cyan), plasmablast-like (CD138+, orange), and IgG+ plasmablast-like (CD138+, brown) B cells and cells with low expression of all markers (light gray). (G) Total SMARTA.Stx11−/− or SMARTA.WT CD4 T cells at d4 of co-culture with WT B cells. Median fluorescence intensity (MFI) of follicular CD4 T cell markers expressed by SMARTA.Stx11−/− (n = 6) or SMARTA.WT (n = 6) after 4 days of co-culture with GP61-80-pulsed WT B cells from n = 4 independent experiments. (A–G) Mean and ± SEMs of Mann–Whitney U test are shown; **P < 0.01, ns indicates not significant.

