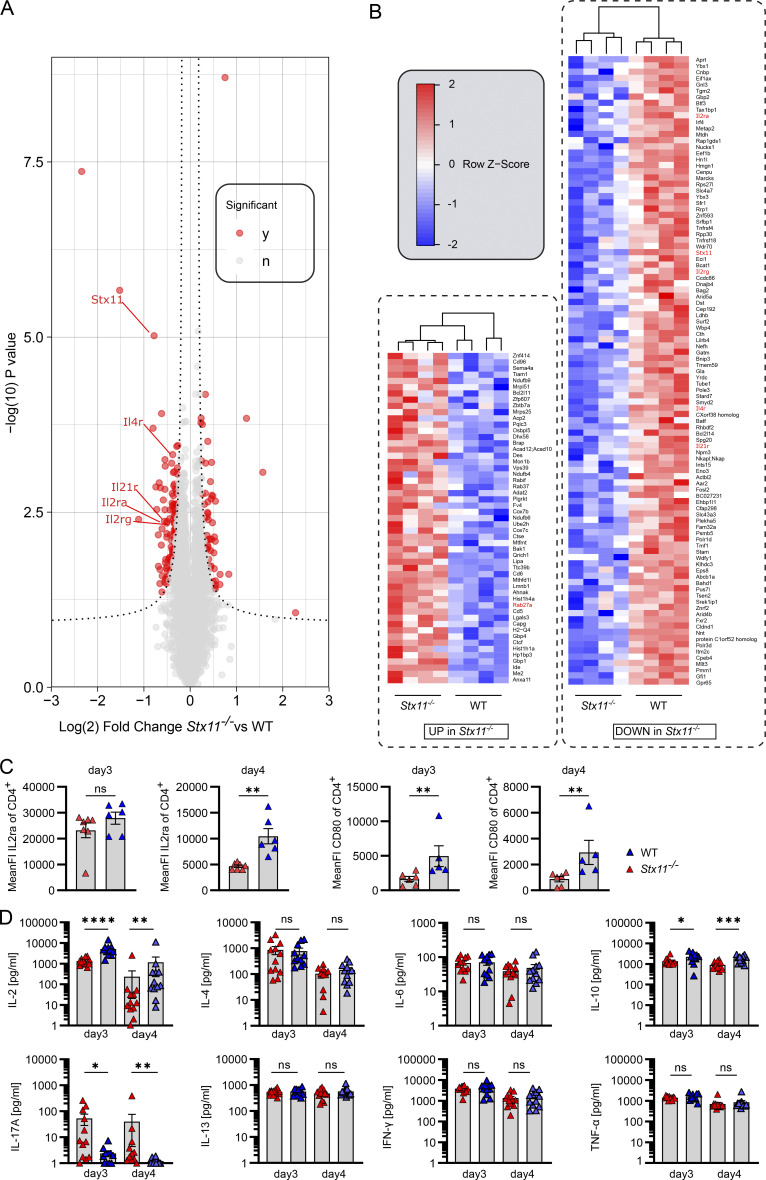
Figure 8.
Reduced IL-2 and IL-10 release and IL2ra expression by Stx11−/− CD4 T cells. (A) Volcano plot of relative protein abundance from mass spectrometric analysis of total protein isolates from sorted SMARTA.Stx11−/− (n = 4) or SMARTA.WT (n = 4) CD4 T cells on day 3 of in vitro T/B interaction (n = 3 independent experiments). The dashed line represents statistical significance at an estimated FDR < 0.05 (two-tailed t test plus permutation-based FDR correction with S0 = 0.1). Significantly altered proteins shown in red. (B) Heat map showing proteins being up- or downregulated in SMARTA.Stx11−/− in comparison to SMARTA.WT after B cell interaction. (C) Mean fluorescence intensity of surface IL2ra and CD80 on CD4 T cells on d3 and d4 of T/B interaction. CD4.SMARTA.Stx11−/− (n = 6–7) or CD4.SMARTA.WT (n = 5–6) (IL2ra n = 4 and CD80 n = 3 independent experiments). (D) Multiplex analysis of cytokines in the supernatant of d3 and d4 of T/B interaction co-cultures. CD4.SMARTA.Stx11−/− (n = 12) or CD4.SMARTA.WT (n = 11–12) of n = 8 independent experiments. (B–D) Mean and ± SEMs of Mann–Whitney U test are shown; *P < 0.05, **P < 0.01, *** P < 0.001, **** < 0.0001, ns indicates not significant.

