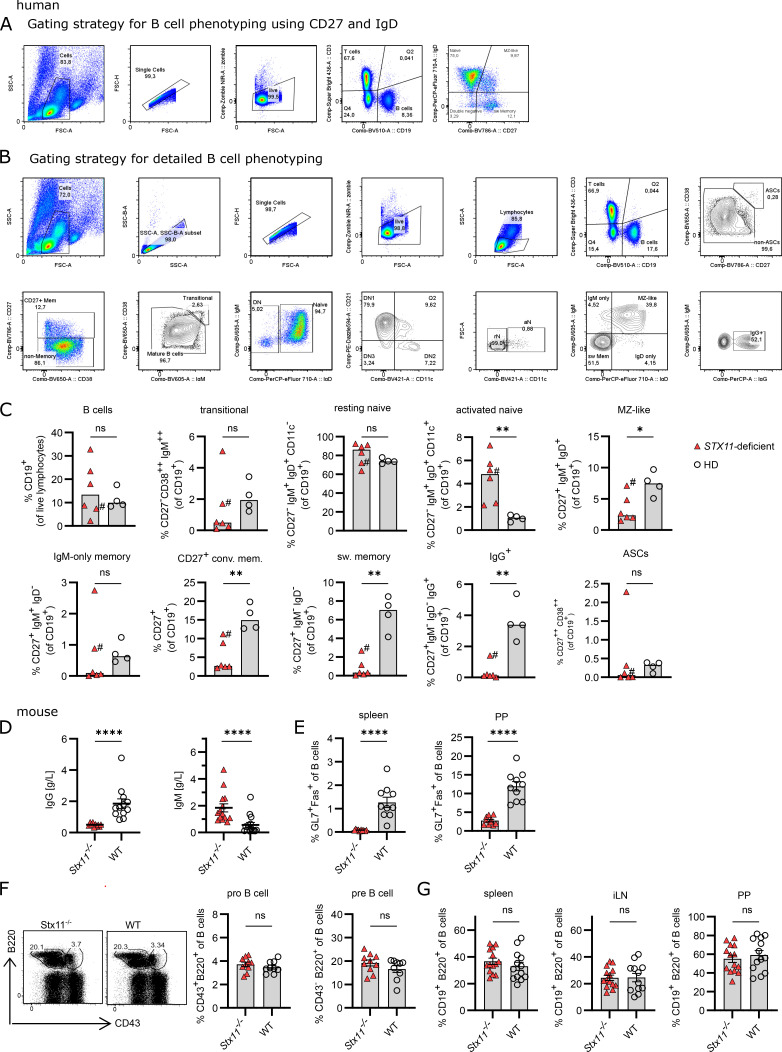
Figure S1.
B cell phenotype of humans and mice with STX11 deficiency. Human: (A) Gating strategy for B cell subpopulation from fresh blood samples or frozen PBMCs related to Fig. 1 B. Naive B cells (CD19+IgD+CD27−), MZ B cells (CD19+IgD+CD27+), DN B cells (CD19+IgD−CD27−), and switched (sw) memory B cells (CD19+IgD−CD27+). (B) Gating strategy for detailed B cell phenotyping and DN B cell subsets of peripheral B cells, related to Fig. 1 C and Fig. S1 C. (C) Detailed B cell phenotyping of peripheral B cells from frozen PBMCs of six STX11−/− (FHL-4) patients and four healthy controls. #, treated at the time of analysis. Mouse: (D) Serum IgG of Stx11−/− (n = 10) and WT (Stx11+/+ n = 12) in n = 4 independent experiments and IgM levels in naive mice Stx11−/− (n = 14) or WT (Stx11+/+ n = 14 and Stx11+/− n = 2) in n = 4 independent experiments. (E) GC B cells (GL7+Fas+ of CD19+B220+) in spleen and Peyer’s patches (PP) in naive mice (Stx11−/− n = 10) or WT (Stx11+/+ n = 9) in n = 3 independent experiments. (F) Frequencies of pro-B cells (CD43+B220+) and pre-B cells (CD43−B220+) in BM Stx11−/− (n = 9) and WT (Stx11+/+ n = 9) in n = 3 independent experiments. (G) B cells (CD19+B220+) in spleen, inguinal lymphnodes (iLN), and Peyer’s patches (PP) (Stx11−/− n = 13) or WT (Stx11+/+ n = 13) in n = 4 independent experiments. (C–G) Mean and SEMs are shown of Mann–Whitney U test, depending on normal distribution; *P < 0.05, **P < 0.01, **** < 0.0001, ns indicates not significant.

