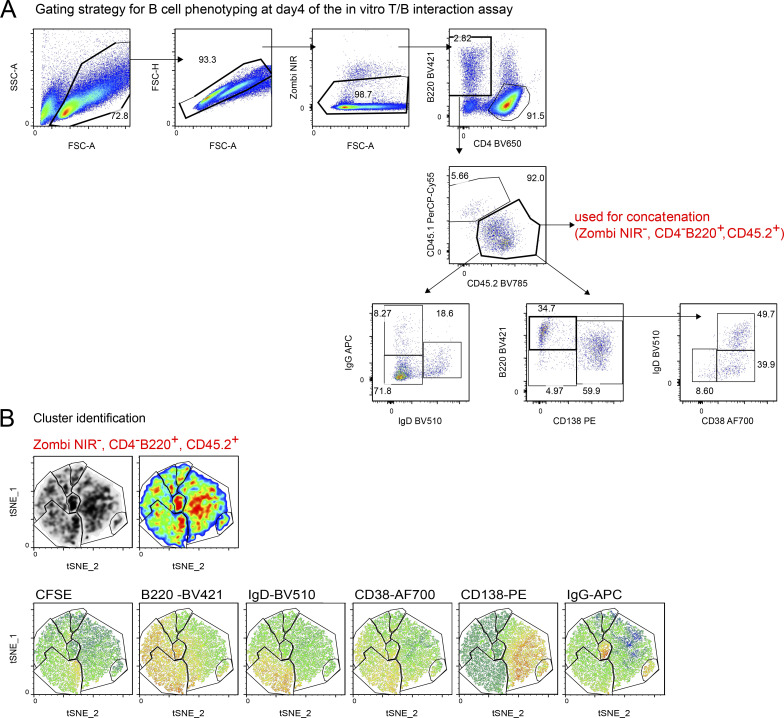
Figure S3.
Cluster identification for t-SNE analysis. (A) Pooled data from B cells co-cultured with SMARTA.WT and SMARTA.Stx11−/− were analyzed with t-SNE: perplexity: 20, itinerary: 2,000. Pre gates for B cells were defined (lymphocytes → single cells → live cells → CD4− B220+) to exclude dead cells and CD4 T cells. (B) Clusters were identified and gated by correlation of density plot, pseudocolor plot, and marker distribution.

