Figure S4.
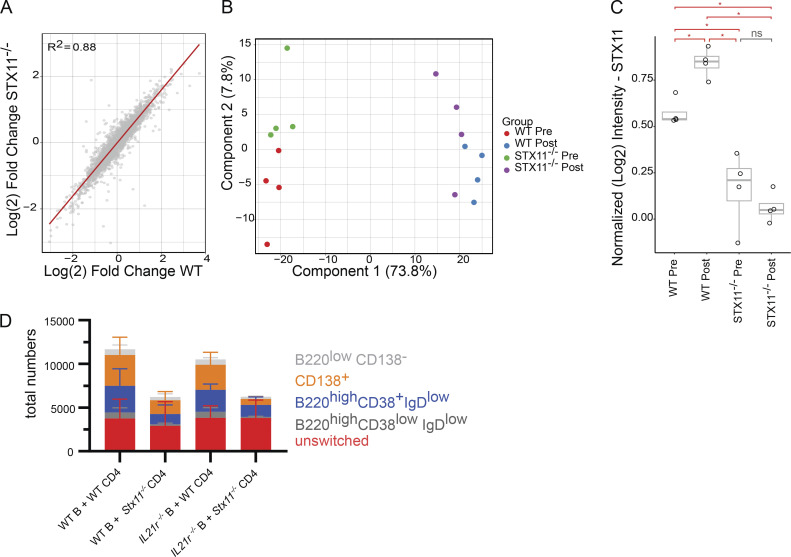
Protein analysis and IL-21 exclusion. (A) Comparison of relative protein abundance changes (Log2 fold change) in SMARTA.Stx11−/− CD4 T cells versus SMARTA.WT CD4 T cells after 3 days of in vitro T/B cell interaction. Proteome alterations induced by T/B cell interaction are remarkably consistent between cell lines (trend line = red line, R2 = 0.88). (B) PCA demonstrates high reproducibility of the assay with samples grouping according to genotype and stimulation. (C) Comparison of normalized STX11 levels between samples (n = 4 all groups). Red bars indicate significance at P < 0.05 (*) (one-way ANOVA and Tukey post-hoc mean comparison). Gray bar indicates not significant (ns) at P < 0.05 level. (D) Differentiation of WT or IL21r-deficient (IL21r−/−) B cells at d4 of T-B cell interaction assay with either SMARTA.WT CD4 T cells (n = 5) or SMARTA.Stx11−/− CD4 T cells (n = 4) (n = 3 independent experiments).

