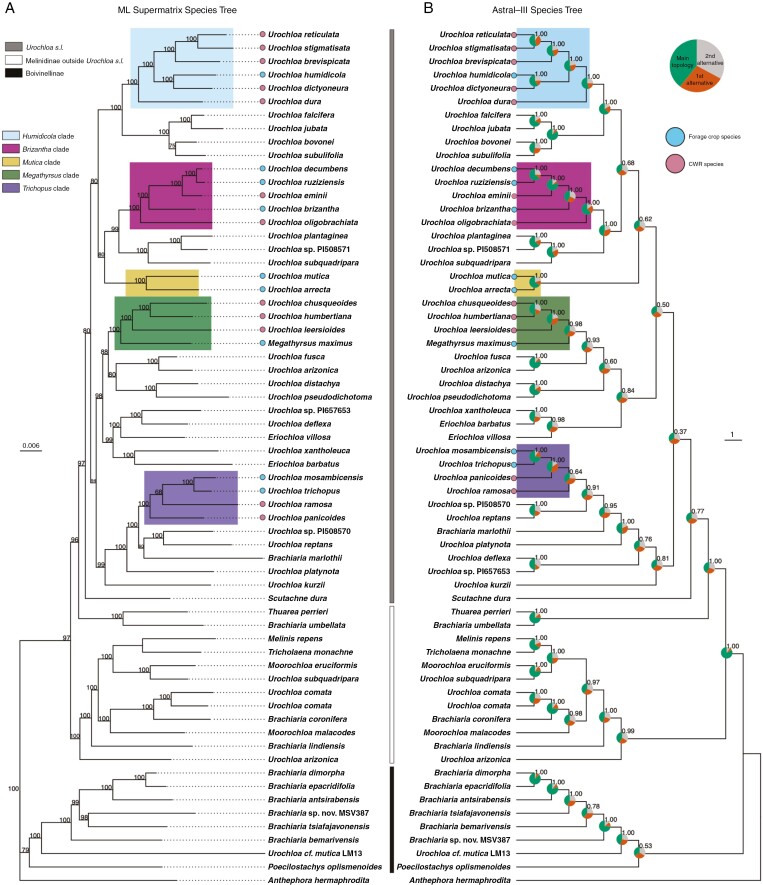
Fig. 2.
Phylogenetic inference of species trees for Urochloa s.l. using a maximum likelihood (ML) method on a concatenated alignment supermatrix using IQTREE2 in (A) and a multispecies coalescent method using ASTRAL-III (B). Numbers above branches in the ML phylogenetic tree (A) represent ultrafast bootstrap support values. For the ASTRAL-III phylogenetic tree (B) branch support is measured as local posterior probability (LPP) plotted above branches, and quartet scores (QS) were calculated and plotted on each node as pie charts. Colours in pie charts represent the main topology (green), the first alternative topology (orange) and the second alternative topology (grey). Forage clades are highlighted in colour in the ML phylogenetic tree (A) and ASTRAL-III phylogenetic tree (B). Scale bar for ML phylogenetic tree (A) indicates nucleotide substitutions per site, and for the ASTRAL-III phylogenetic tree (B) the scale bar indicate coalescent units. Forage species are indicated with blue dots at tips and CWR species are indicated at tips with pink dots. Taxa defined as Urochloa s.l. in the analysis are indicated with a dark grey bar. Taxa defined as sitting outside Urochloa s.l. but within the same subtibe Melinidinae are indicated with a white bar. Taxa within the Boivinellinae, including Brachiaria species endemic to Madagascar previously placed in Boivinellinae (Hackel et al., 2018), are indicated with a black bar.

