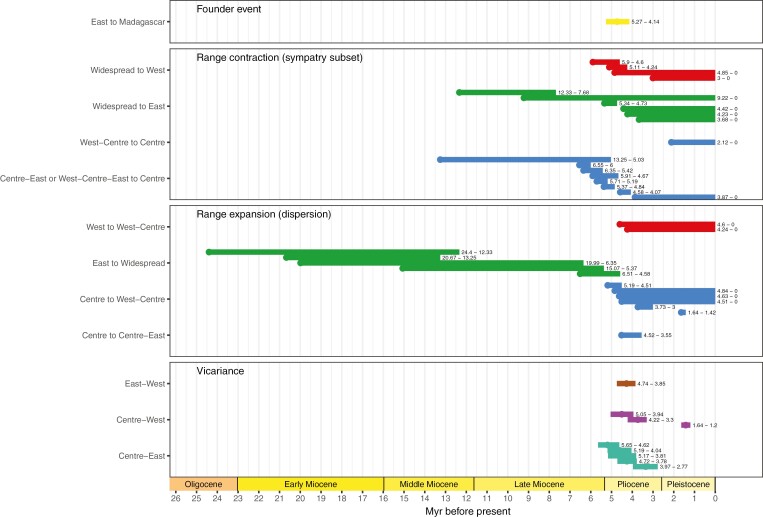
Fig. 4.
Chronological time frame of the biogeographical events as interpreted from the dispersal–extinction–cladogenesis (DEC) model. The founder event and vicariance events occurred at nodes of the tree in Fig. 3: the dot and horizontal bar represent the mean age and 95 % highest posterior density interval of the age of the node, respectively. Range contraction (RC) and range expansion (RE) events occurred along branches connecting two nodes: the dot represents the mean age of the widespread (RC) or endemic (RE) ancestral node, and the horizontal bar extends toward the mean age of the endemic (RC) or widespread (RE) daughter node. Colours follow the DEC ranges (see Fig. 3) and have different meaning depending on the event: for founder events, it is the colour of the range after the founder event; for range contraction, it is the colour of the endemic range after range contraction; for range expansion, it is the colour of the endemic range before range expansion; and for vicariance, it is the colour of the widespread range before the vicariance event. Labels on the y-axis indicate the direction of the event (e.g. range expansion from East to Widespread). ‘Widespread’ includes all the widespread ranges (West-Centre, Centre-East or West-Centre-East). See Material and Methods for the details of the events.

