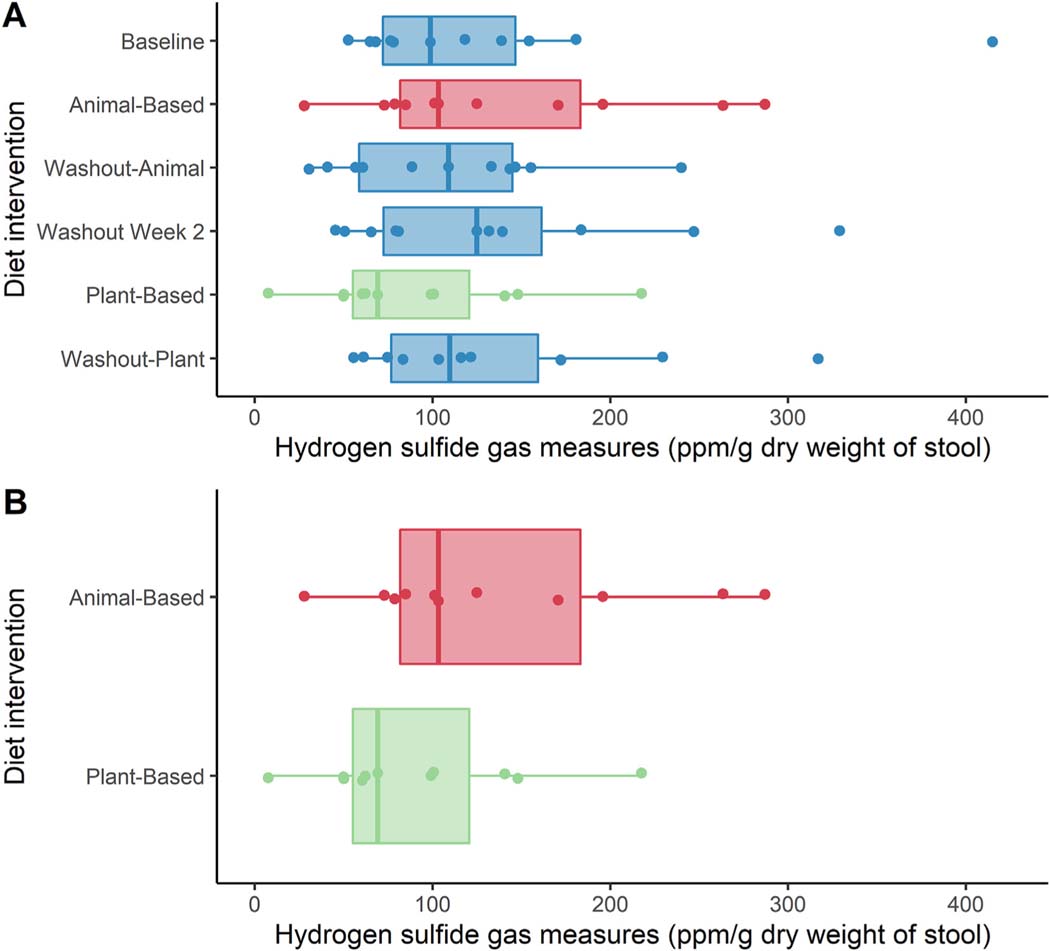
Fig. 1.
A: Box plots of H2S distribution at each time point during the study interval. There was no overall difference in H2S production between diet weeks (p = 0.70), B: box plot of H2S distribution during animal- and plant-based diet weeks. Median H2S production was higher following the animal-based diet compared to the plant-based diet (p = 0.02; median difference 29 ppm/g, 95% CI 16–97).

