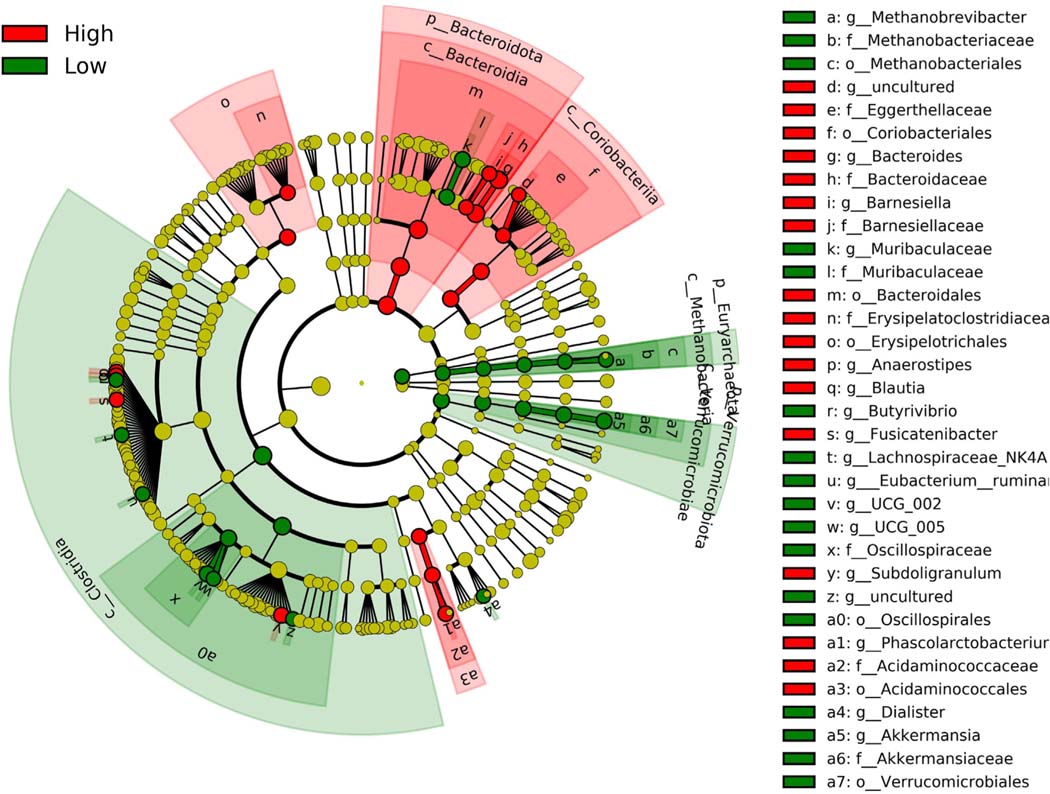
Fig. 5.
Linear discriminant analysis (LDA) combined with effect size measurements (LEfSe) comparing responders (“High”) and non-responders (“Low”). Enrichment of taxa in the responder groups are presented in red and enrichment of taxa in the non-responder group presented in green. (For interpretation of the references to color in this figure legend, the reader is referred to the Web version of this article.)

