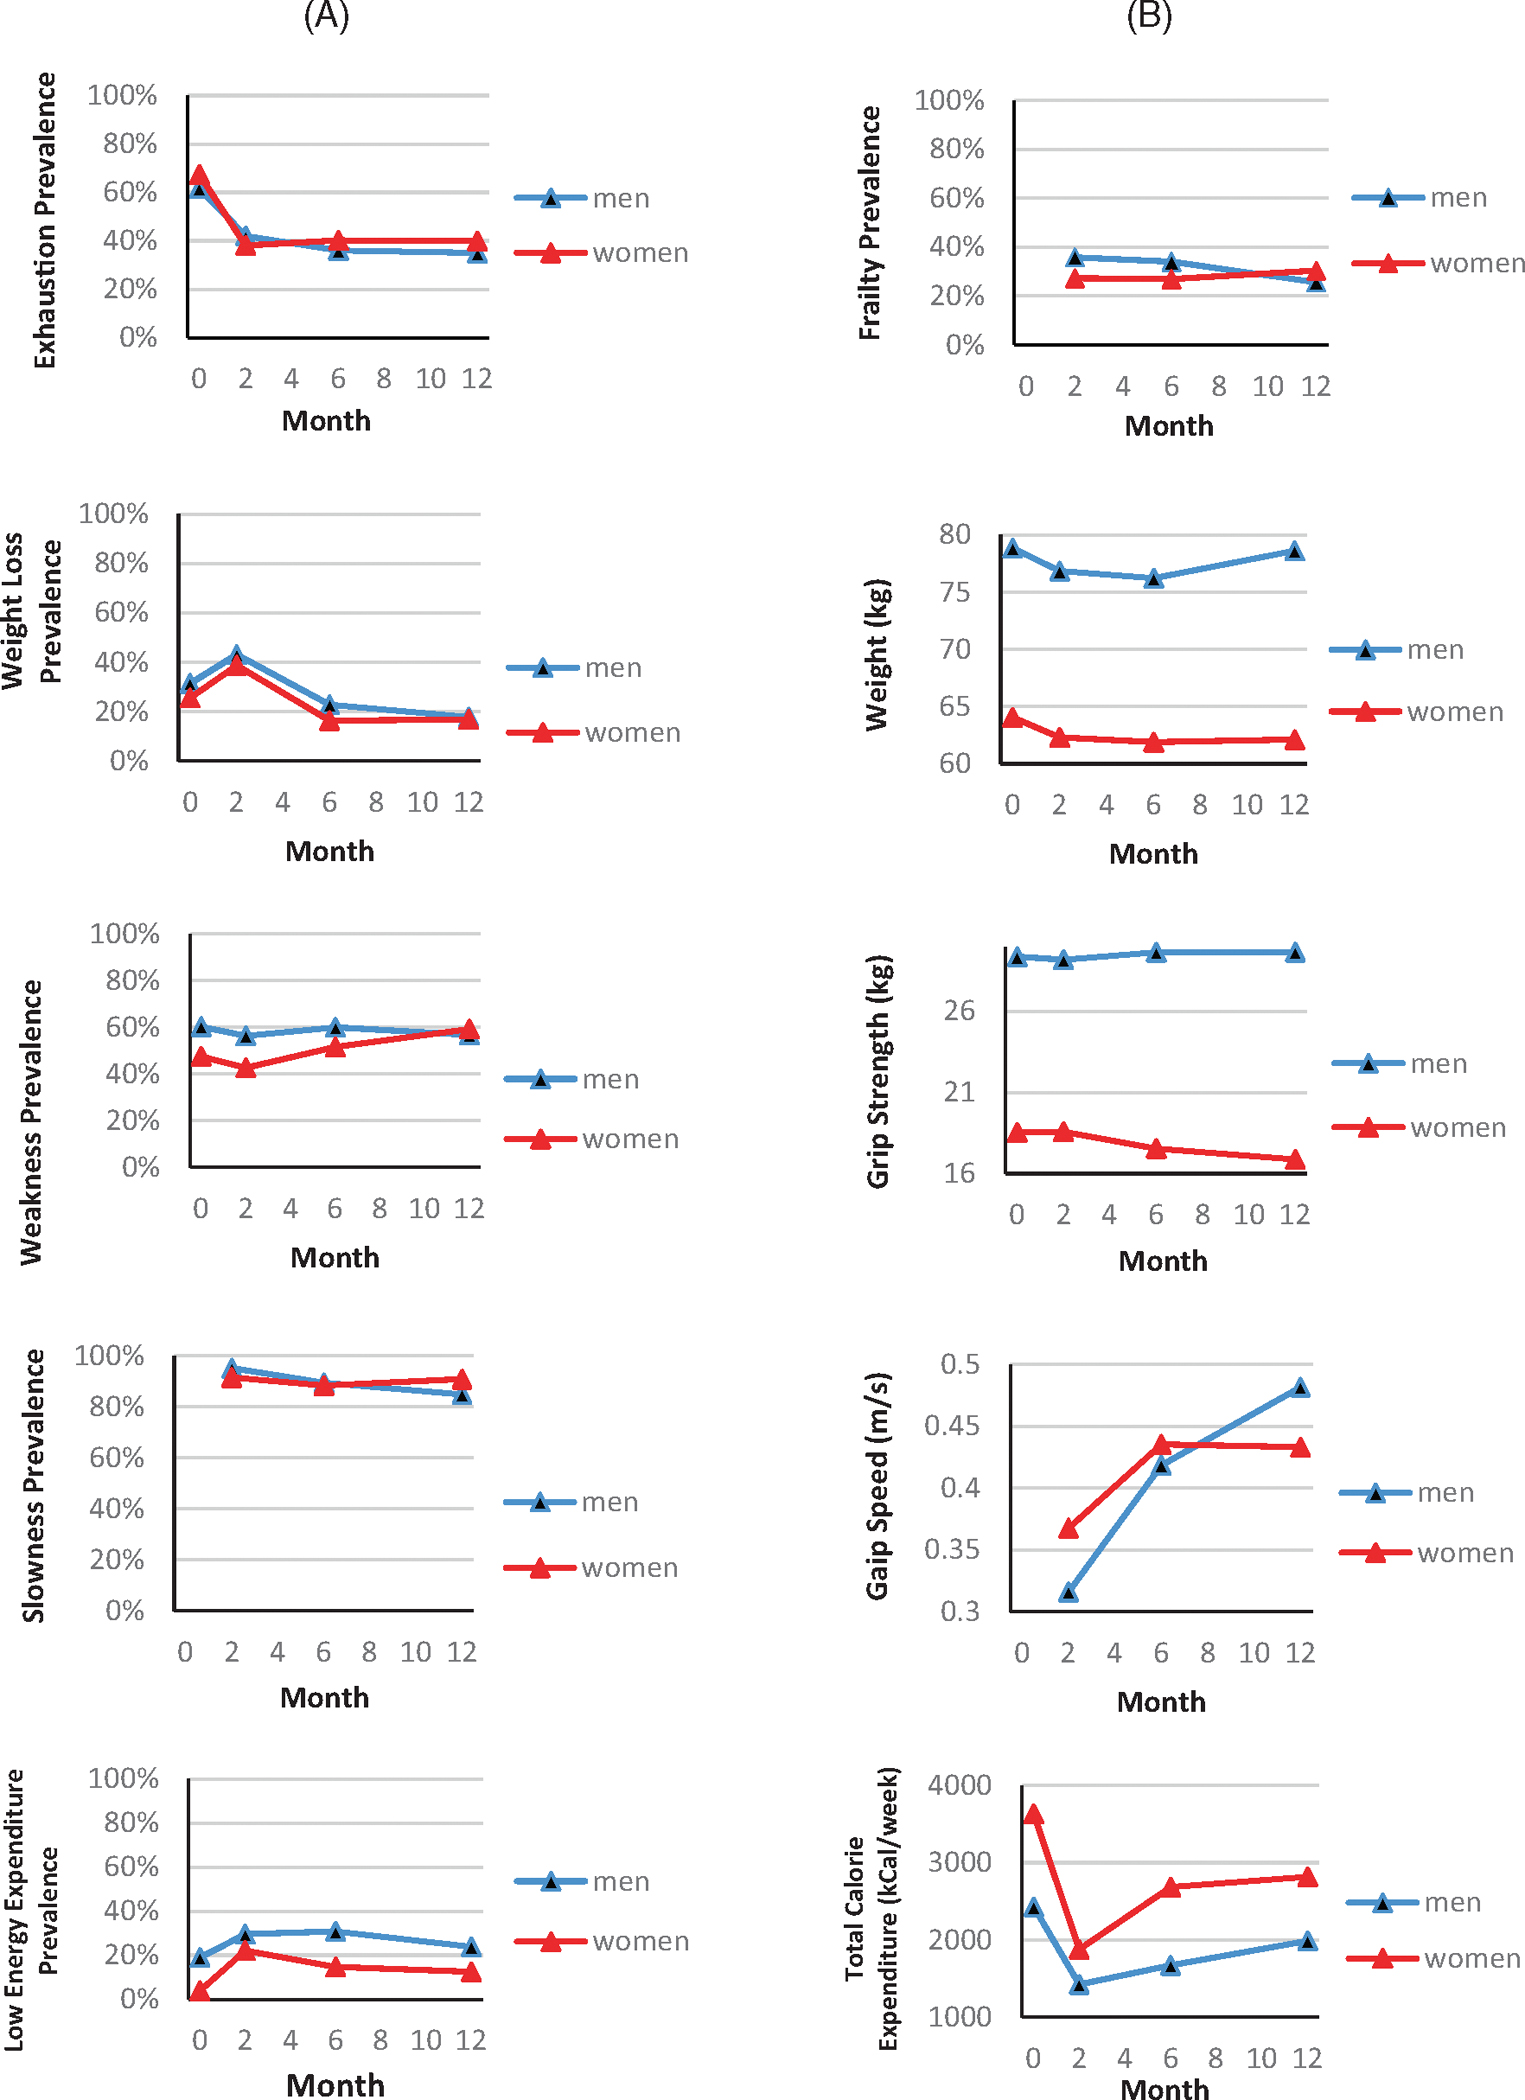
FIGURE 1.

Longitudinal trajectory differences of frailty and its components across men and women over 1 year post hip fracture. Panel (A): frailty binary components, including (from top to bottom) exhaustion, weight loss, weakness, slowness, and low energy expenditure. Panel (B): overall frailty and its continuous components in their original scales, including (from top to bottom) overall frailty (binary), weight (kg), grip strength (kg), gait speed (m/s), and total caloric expenditure (kcal/week). Except the first row, the plots in each row are paired to show the longitudinal trajectories of the same frailty components in the binary scale (panel A) and continuous scale (panel B).
