
FIGURE 2.
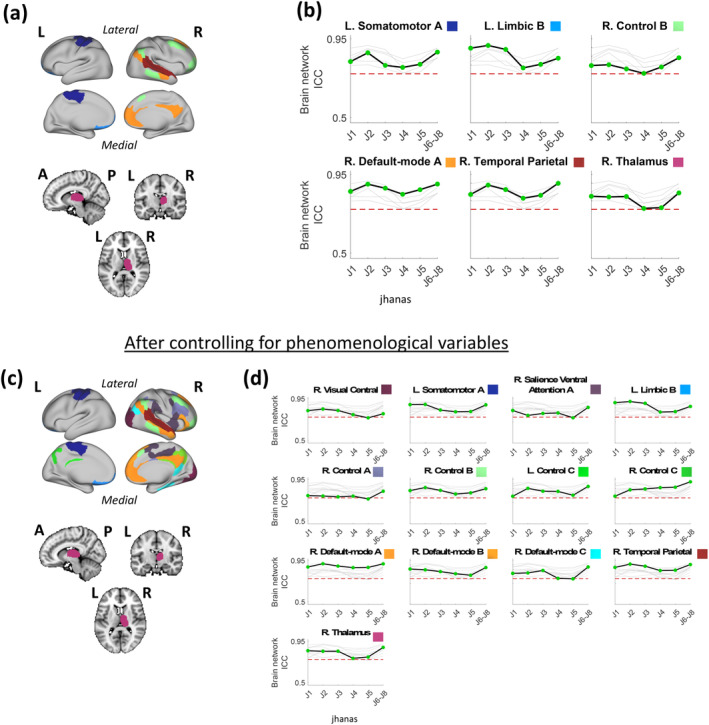
Brain surface (cortex) and volume (subcortex) visualizations of brain networks/groups with above‐threshold reliability across jhanas J1–J8, alongside graphical representations of changes in the lower confidence limits of their brain network ICC values across the sequential jhanas. Note that jhanas J6–J8 were merged as one advanced state. (a) The six brain networks/groups with above‐threshold reliability (ICC lower confidence limit ≥0.75) across jhanas J1 to J8 have been shown on the brain using distinct colors. Each color is labeled in panel (b). (b) Change in the lower confidence limit of brain network ICC across jhanas in each of the six networks/groups relative to one another, where ICC change of only the labeled network/group is highlighted (black line) in each graph while the remaining networks/groups are grayed out in the background. The network/group label above each graph is accompanied by its respective color as shown on the brain map in panel (a). The y‐axis of each graph represents brain network ICC values while the distinct jhanas (J1 to J6–J8) are marked on the x‐axes. (c) Similar to (a) showing 13 common brain networks/groups but after controlling the region‐level ReHo values for key self‐report phenomenological variables (1 value per fMRI run per jhana) including “Attentional stability,” “Attentional width,” and “jhana intensity.” (d) Similar to (b) after controlling the region‐level ReHo values for the self‐report phenomenological variables. The network/group label above each graph is accompanied by its respective color as shown on the brain map in panel (c). The dotted red line in each graph (in (b) and (d)) represents the threshold of “good” brain network ICC (i.e., ICC lower confidence limit of 0.75). A, anterior; fMRI, functional magnetic resonance imaging; ICC, intraclass coefficient correlation; L, left; P, posterior; R, right; ReHo, regional homogeneity.