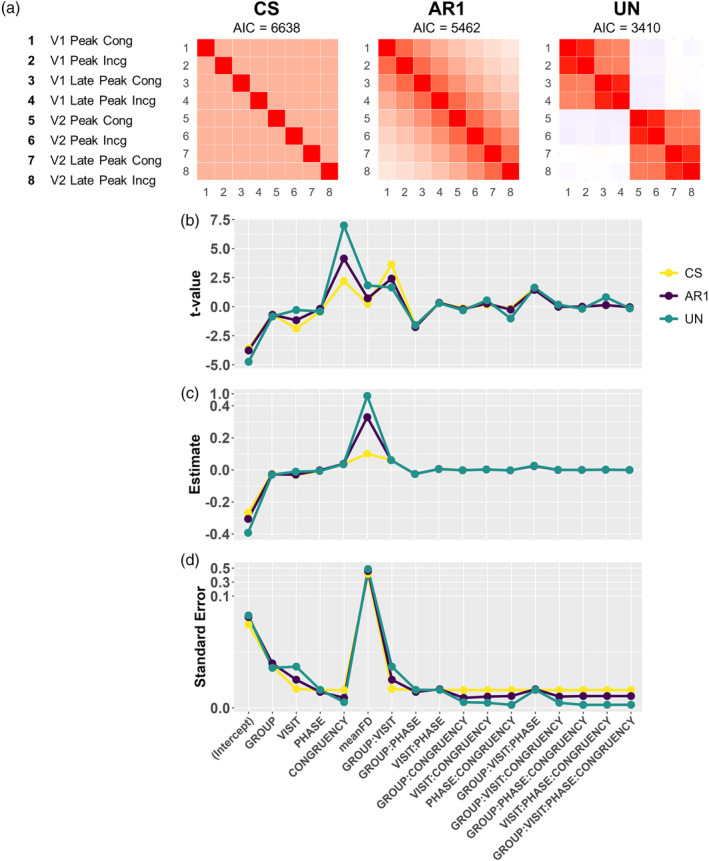
FIGURE 2.

Summary statistics and model parameters for the three variance–covariance structures for a single voxel located in the right precuneus. Panel a shows the variance–covariance structures and Akaike Information Criterion (AIC). The t‐statistics, estimates (unstandardized beta coefficients) and standard errors are plotted in Figure 2b–d, exhibiting the inverse relationship between the t‐values and standard errors. Note the piecewise linear y‐axis scales in Panels c and d.
