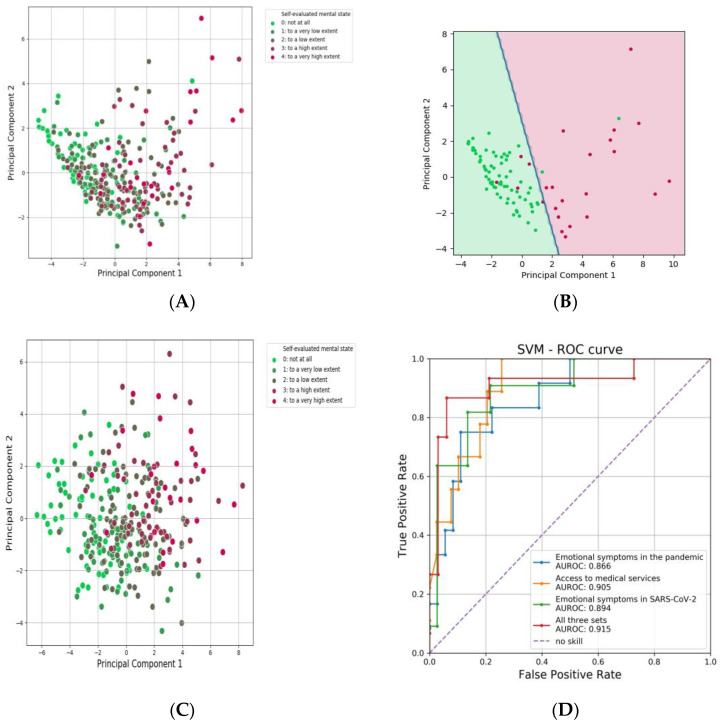
Figure 8.
PCA analysis of the separation of responses by self-reported mental state. (A) dot plot of the separation of levels of psychological impairment based on affective symptoms during pregnancy, during illness, and access to medical services; (B) dot plot of the separation of levels of mental impairment based on all questions in the questionnaire; (C) the cutoff between no impairment and highly impaired mental status according to the SVM analysis based on the three sets of questions from (A); (D) the result of the logistic regression for the discrimination of patients with “very much” versus “not at all” impairment based on the three sets of questions.

