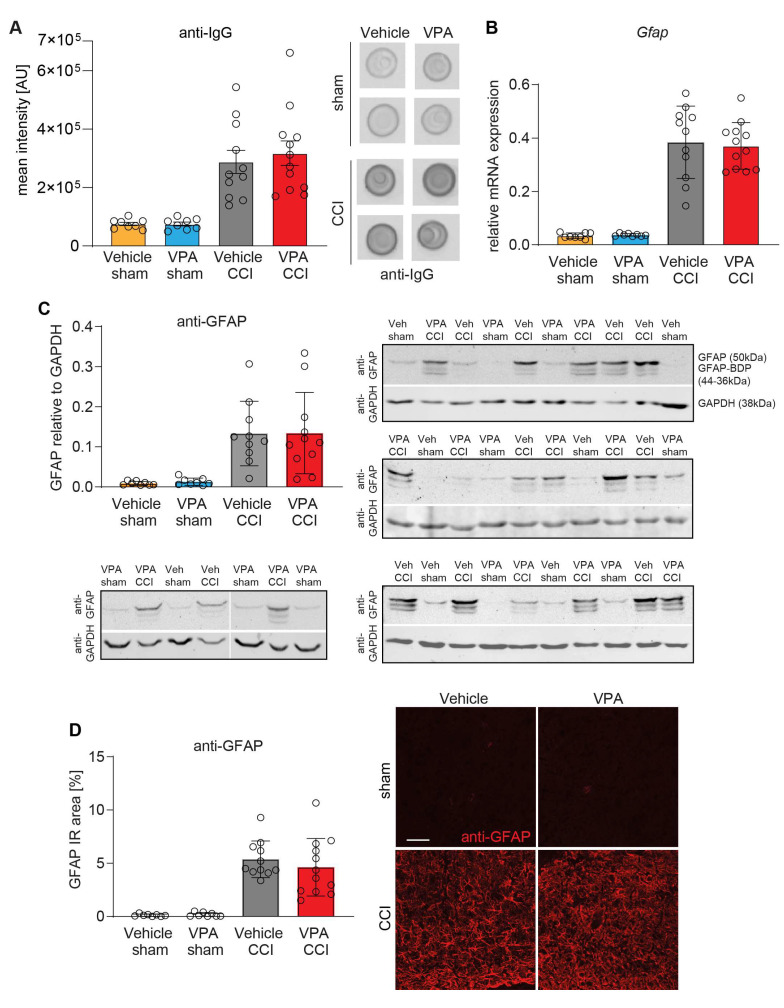
Figure 4.
VPA treatment does not affect BBB disruption and astrocyte activation at 7 dpi. (A) Quantification of IgG extravasation into brain tissue. Representative examples of immuno-dot blots from the lesioned hemisphere at 7 dpi and corresponding sham tissue are shown. (B) Gene expression analysis of the astrogliosis marker GFAP normalized to Ppia. (C) Quantification of GFAP protein levels and breakdown products (BDPs) relative to GAPDH. One sample from vehicle CCI and VPA CCI was excluded because the corresponding GAPDH reference band could not be correctly quantified. Anti-GFAP/anti-GAPDH immunoblots are shown. (D) Quantification of the anti-GFAP immunoreactivity (IR) area. Representative examples of immunofluorescence images are shown (scale: 50 µm). Data are expressed as mean ± SEM with individual values shown, p values were calculated by one-way ANOVA followed by comparison of pre-defined pairs (Vehicle versus VPA treatment) using t-test with α adjustment according to Holm–Šidák.

