Figure 5.
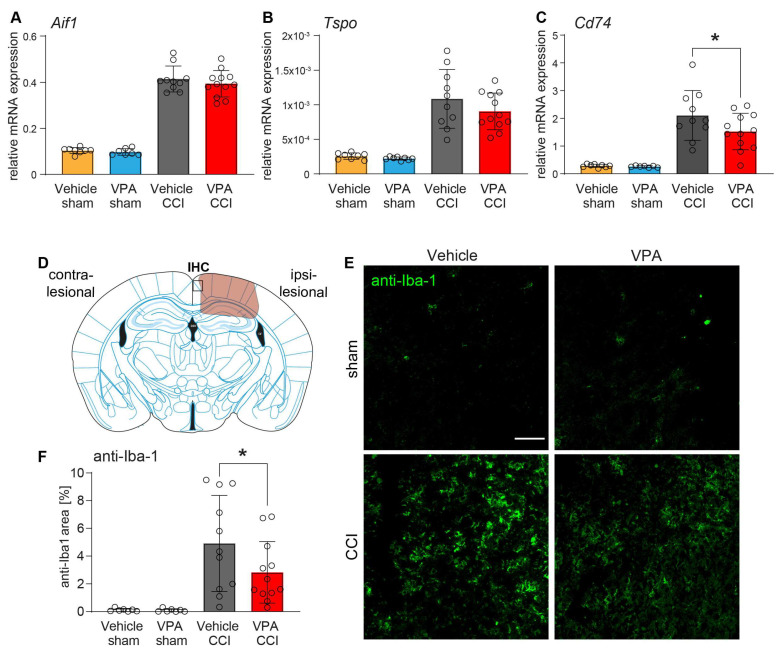
Microglia activation after CCI is reduced by VPA. Gene expression analyses of the microglia markers Aif1 (A), Tspo (B, 18 kDa translocator protein) and Cd74 (C) normalized to Ppia. (D) Scheme showing the lesion core (orange) and the region of interest for the examination of microglial activation by anti-Iba1 immunohistochemistry (IHC, black box) medial to the lesion site. (E) Images of anti-Iba1 immunostaining showing perilesional microglia activation 7 dpi (scale 50 µm). (F) Quantification of the anti-Iba-1 immunoreactive area medial to the lesion site. Sample size: vehicle CCI: n = 11, VPA CCI: n = 12, vehicle sham: n = 8, VPA sham: n = 8. Data are expressed as mean ± SEM with individual values shown and p values (* p < 0.05) were calculated by one-way ANOVA followed by comparison of the treatment-relevant groups (CCI-Vehicle versus CC-VPA) using t-test.

