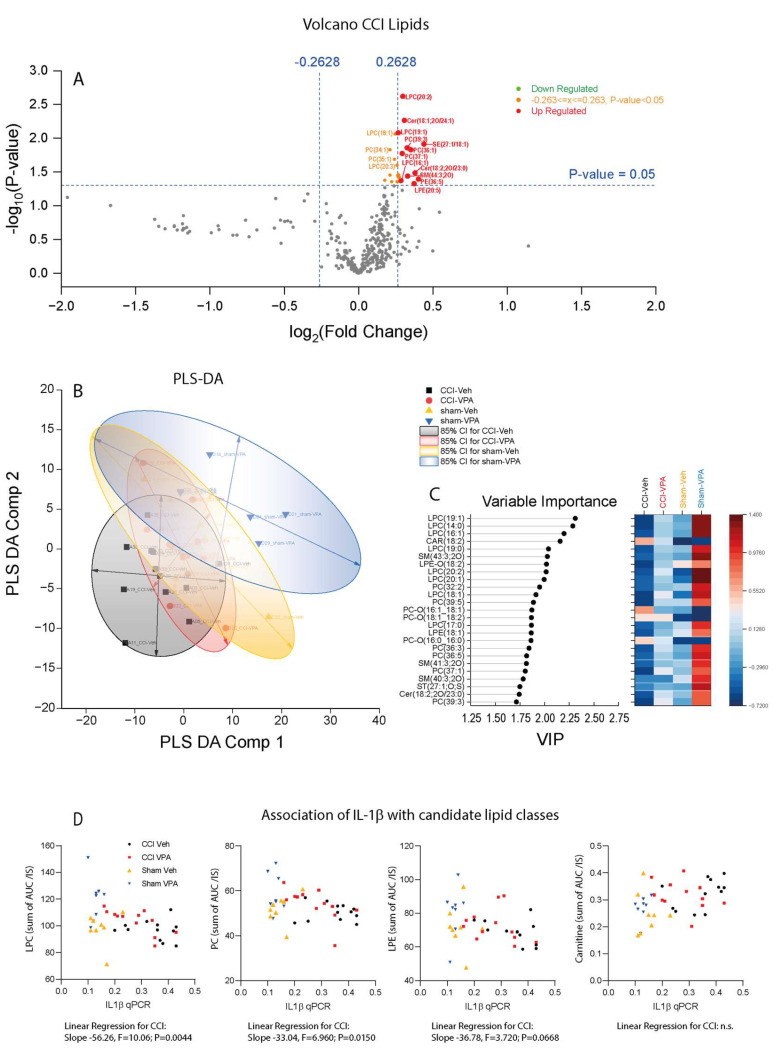
Figure 7.
Lipidomic analysis of plasma samples 7 days after controlled cortical impact (CCI) or sham surgery in animals treated with vehicle or VPA (3 dpi 400 mg/kg VPA i.p.). (A) Volcano plot of CCI-Vehicle versus CCI-VPA. Lipids increased in the VPA group are on the right side of the x-axis (sham groups in Supplementary Figure S4A). (B) Partial least square discriminant analysis (PLS-DA) component 1 versus component 2 scatter plot and 85% confidence ellipses. Two sham-VPA animals were excluded, which were identified as outliers by random forest analysis. (C) Variable importance plot (VIP) of PLS-DA component-1. (D) XY-scatter plots showing the association of lipid classes versus Il1b mRNA. To obtain a summary value of a lipid class, individual AUC/IS values of individual lipid species with different chain lengths and saturation of the respective class were summed. Associations with TNFα are shown in Supplementary Figure S6A. Sample sizes: controlled cortical impact (CCI) vehicle n = 12, CCI VPA n = 12, sham vehicle n = 8, sham-VPA n = 8. Abbreviations of lipids: CAR, carnitines; CER, ceramides; LPC, lysophosphatidylcholine; PC, phosphatidylcholine; LPE, lysophosphatidylethanolamine; SE, steryl ester; SM, sphingomyelins; ST, sterols.

