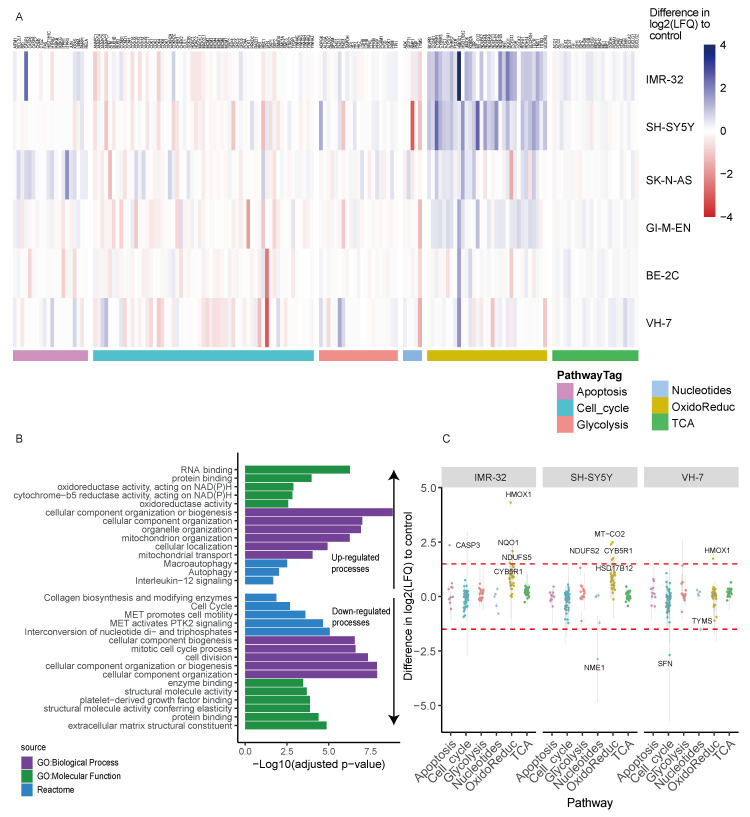
Figure 2.
Proteomic analysis of L-GA treated neuroblastoma cells. (A) Proteomic analysis of cell lines: BE-2C, GI-M-EN, VH-7, SH-SY5Y, IMR-32 and SK-N-AS treated for 24 h with 1 mM L-GA or PBS and subjected to LC-MS proteomic analysis. Hierarchical clustering of cell lines show the clustering of pathways between cell types. Data represent the difference in Log2 label-free quantity Log2(LFQ) of L-GA-treated cells relative to PBS-treated cells, n = 3 for each cell line. (B) GO enrichment analysis of data filtered by >1 and <−1 difference Log2(LFQ) of L-GA-treated cells relative to PBS control in all cell lines. The top five term names, defined by a lower adjusted p-value < 0.05, of the GO:Molecular function, GO:Biological process and REACTOME are presented. (C) Proteins from (A) were filtered by >1.5 and <−1.5 difference Log2(LFQ) of L-GA-treated cells relative to PBS in IMR-32, SH-SY5Y and VH-7. Filtered proteins are highlighted by a red dotted line. Proteins that show differences outside of this line are labeled by text.

