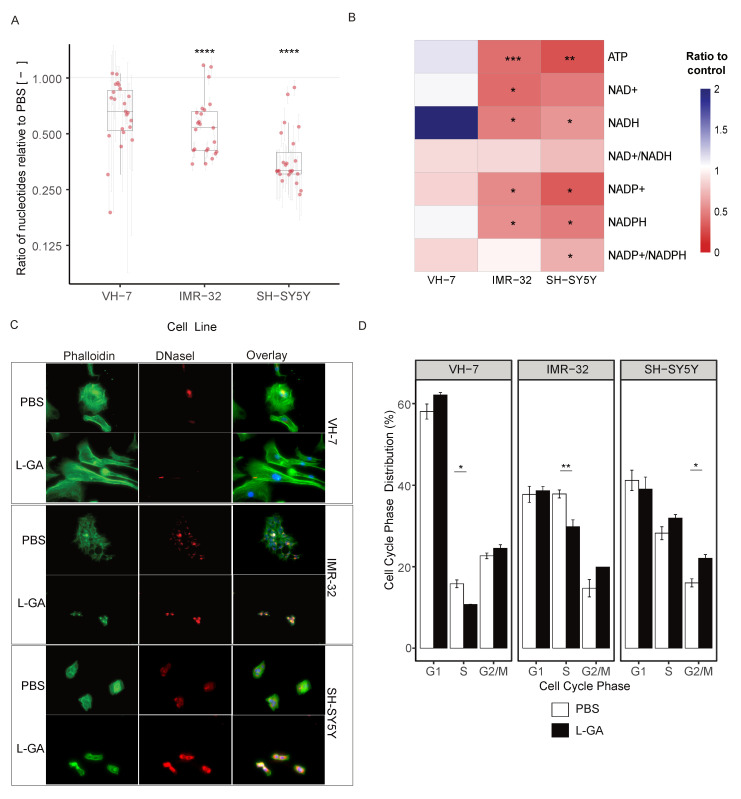
Figure 3.
L-GA causes cytoskeletal aberrations and cell cycle arrest within 24 h. (A) Cell lines VH-7, IMR-32 and SH-SY5Y were treated with PBS or 1.0 mM LGA 24 h. Nucleotides were extracted and measured by DI-MS/MS. Boxplots represent the mean ratio in each DNA and RNA nucleotide intensity normalized to PBS (n ≥ 3). Error bars represent ±SEM of each nucleotide measured. p-values were calculated using a two-tailed t-test. (B) Cells were treated as in (A); intensities of ATP, NAD+, NADH, NADP+ and NADH with associated ratios were calculated and normalized to PBS (n≥ 3). p-values were calculated using a two-tailed t-test. (C) Cell lines VH-7, IMR-32 and SH-SY5Y were fixed to glass slides and stained with DAPI and Phallodin-iFluor(F-) or Deoxyribonuclease I (G-) actin probes then imaged at 40× magnification using Keyence Bz-x700 microscope. Images are exemplary of 3 independent slides. (D) SH-SY5Y, IMR-32 and VH-7 were treated with 1 mM L-GA or PBS for 24 h and subjected to flow cytometry analysis. Cells were gated for cell cycle phases G1, S, and G2/M. The mean of the percentage of cells in each phase was calculated (n = 3). Error bars represent ± SEM. Two-tailed t-tests were conducted in each phase between treatments. * 0.05; ** 0.01; *** 0.001; **** 0.0001.

