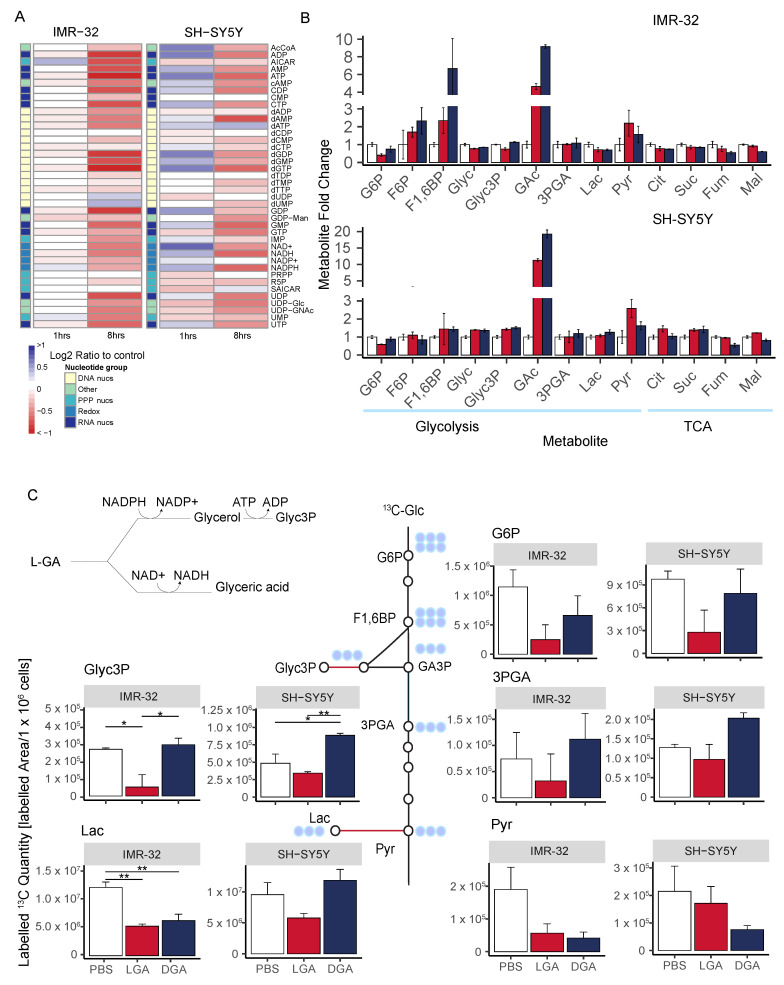
Figure 4.
L-GA selectively and rapidly inhibits glycolysis. (A) Cell lines IMR-32 and SH-SY5Y were treated with 1 mM L-GA for 1 or 8 h. Nucleotides were extracted and measured by DI-MS/MS. The fold change in nucleotide intensity relative to PBS was calculated for representation by heatmap (n = 4). (B) Polar metabolites were extracted from IMR-32 and SH-SY5Y cell lines following the treatment of 1 mM L-GA or 1 mM D-GA for 1 h. Samples were processed via GC-MS and analyzed to attain the abundance of metabolites relative to PBS. Bar charts represent the metabolite mean fold change, error bars represent ± SEM (n = 3). (C) Cell lines IMR-32 and SH-SY5Y were treated with 1 mM L-GA or 1 mM D-GA for 1 h and labeled for 10 min with U-13C-glucose within the treatment time. Bar charts depict the mean labeled 13C-quantity (labeled peak area/ cells) of depicted metabolites. Error bars represent ± SEM (n = 3). p-values were calculated using ANOVA and Tukey post hoc tests. * 0.05; ** 0.01.

