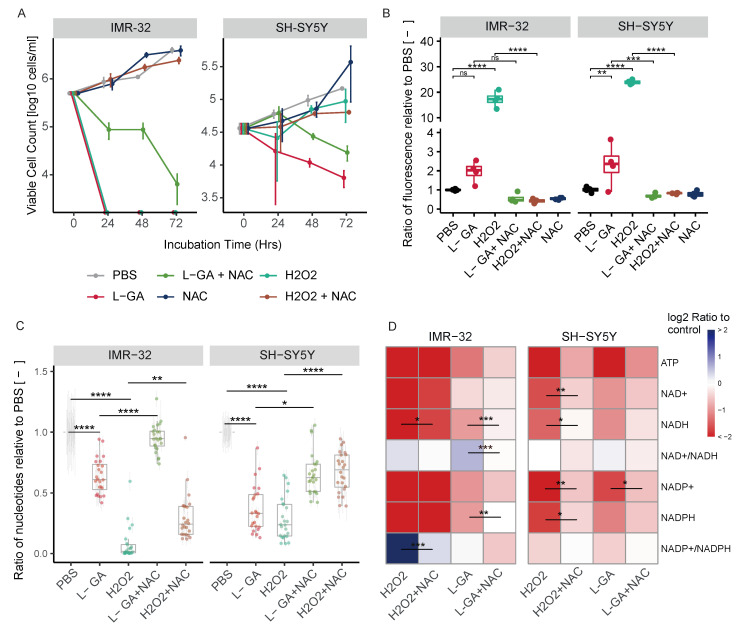
Figure 5.
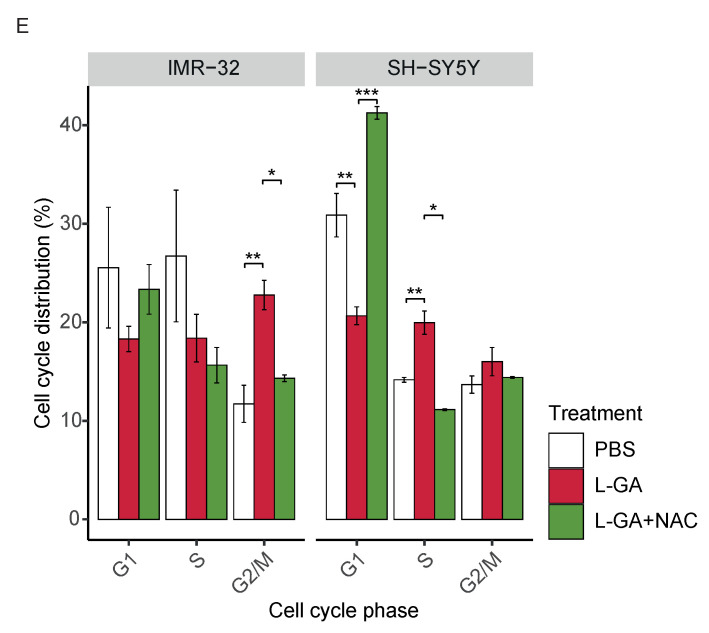
L-GA induces oxidative stress which is linked to cell growth, nucleotide synthesis and the cell cycle. (A) IMR-32 and SH-SY5Y were treated for 72 h with 1 mM L-GA, 100 M H2O2 and 5 mM NAC, in the combinations shown. Viable cell counts were taken every 24 h. Error bars represent the ± SEM (n = 3). (B) IMR-32 and SH-SY5Y were treated for 4 h in combination as in (A). ROS species were quantified by measuring the fluorescence from DCFDA. Box plots show the ratio of fluorescence relative to the PBS control (n = 4). p-values were calculated using ANOVA and Tukey post hoc analyses. (D) Cells were treated as in (C); the intensities of ATP, NAD+, NADH, NADP+ and NADH with associated ratios were calculated and normalized to PBS (n = 4). p-values were calculated using ANOVA and Tukey post hoc analyses. (E) Cell cycle analysis was performed in IMR-32 and SH-SY5Y cells following treatment for 24 h with PBS, 1 mM L-GA or 1 mM L-GA + 5 mM NAC. Cells were gated into phases for ANOVA and Tukey post hoc analyses on the cell cycle distributions (n = 3). ns 0.05; * 0.05; ** 0.01; *** 0.001; **** 0.0001.


