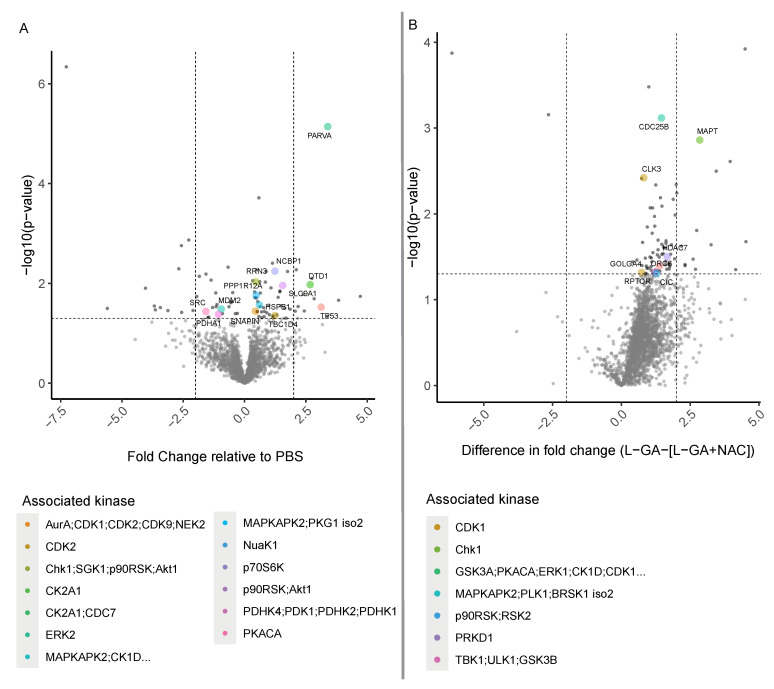
Figure 7.
Phosphoproteomic analysis of L-GA-treated cells. (A) IMR-32 cells were treated for 4 h with 1 mM L-GA, 1 mM L-GA + 5 mM NAC and PBS and harvested for phosphoproteomic analysis (n = 4). Phosphopeptides were measured by LC-MS and fold changes were calculated for L-GA/PBS and L-GA+NAC/PBS. Significant phosphopeptides were found by ANOVA followed by Tukey post hoc tests, colored by the associated kinase. Phosphopeptide sequences were annotated with a protein name and associated kinase. (B) Fold change data between L-GA and L-GA+NAC treatment were passed to a two-tailed t-test. Significant peptides were annotated with protein names and associated kinases and highlighted in red (n = 4).

