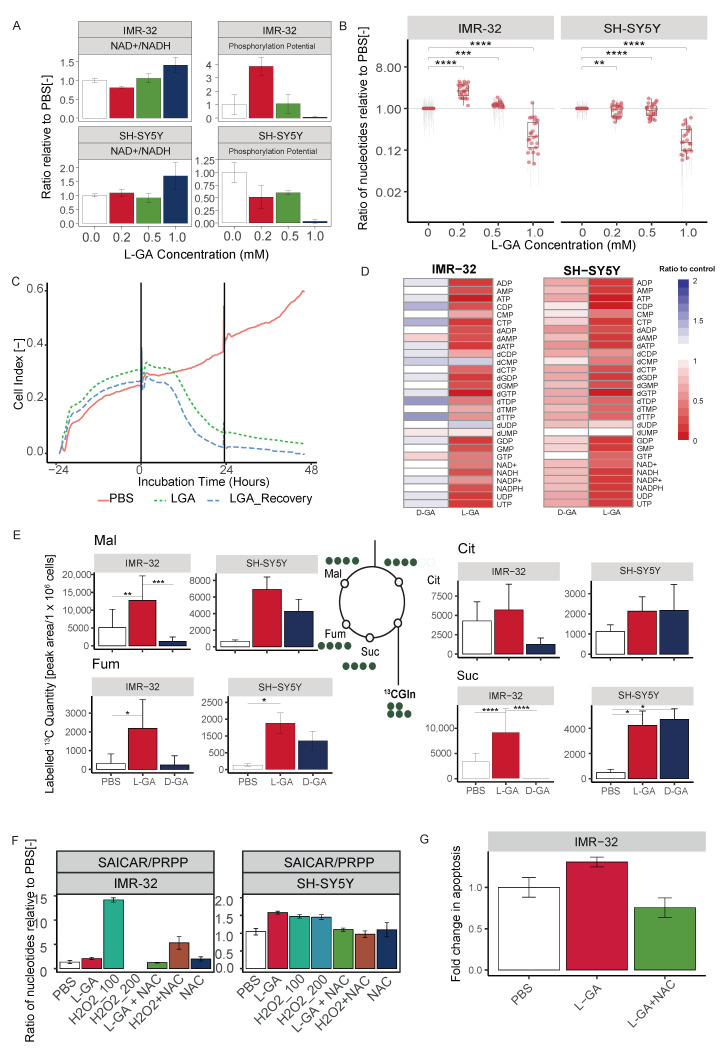
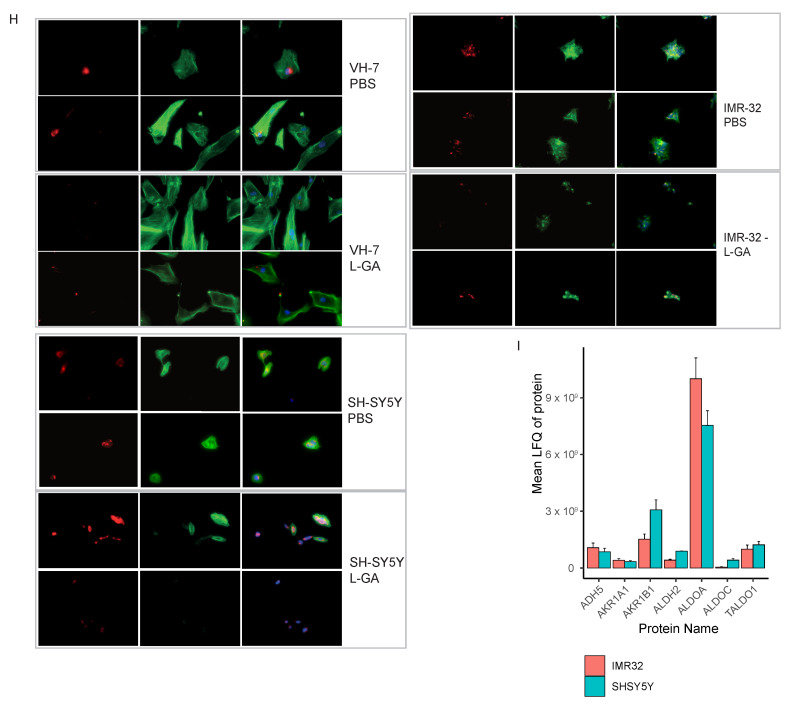
Figure A1.
(A) IMR-32 and SH-SY5Y cells were treated with a range of L-GA concentrations for 24 h. Nucleotide intensities were measured by DI-MS and used to calculate the mean NAD/NADH and phosphorylation potential ratio and normalized to PBS. Errors bars show ±SEM (n = 3). (B) IMR-32 and SH-SY5Y cells were treated with a range of L-GA concentrations for 24 h. DNA and RNA nucleotide intensities were measured by DI-MS and normalized to PBS (n = 3). (C) IMR-32 cells were seeded in an iCelligence device and allowed to settle before the exchanging of media for 1 mM L-GA or PBS. Following 24 h incubation, the media were exchanged with fresh media or media containing 1 mM PBS to simulate recovery. (D) IMR-32 cells were treated with 1 mM L-GA or 1 mM D-GA for 24 h, nucleotide intensities were measured by DI-MS and normalized to PBS for heatmap representation (n≥ 3). (E) Cell lines IMR-32 and SH-SY5Y were treated with 1 mM L-GA or 1 mM D-GA for 1 hr and labeled for 30 min with U-13C-glutamine within the treatment time. Bar charts depict the mean labeled 13C-quantity (labeled peak area/ cells) of depicted metabolites (m + 4). Error bars represent ±SEM (n = 3) and p-values were calculated using ANOVA and Tukey post hoc tests. (F) IMR-32 and SH-SY5Y were treated for 24 h with 1 mM L-GA, 100 M H2O2 and 5 mM NAC and in the combinations shown. Nucleotides were extracted from cell lysates and measured by DI-MS/MS. The bar chart presents the mean intensity of product substrate ratios normalized to PBS, error bars ±SE (n = 4). (G) IMR-32 cells were incubated for 5 h with 1 mM L-GA, 1 mM L-GA + 5mM NAC. For each replicate, 10.000 cells were measured by flow cytometry. Bar charts represent the mean ±SEM (n = 3). (H) Cell lines VH-7, IMR-32 and SH-SY5Y were fixed to glass slides and stained with Phallodin-iFluor(F-) or Deoxyribonuclease I (G-) actin probes, then imaged at 40× magnification using Keyence Bz-x700 microscope. (I) Proteomic analysis of cell lines: SH-SY5Y and IMR-32. Data represent the mean label-free quantity of untreated cells, and error bars represent ± SEM (n = 3). * 0.05; ** 0.01; *** 0.001; **** 0.0001.


