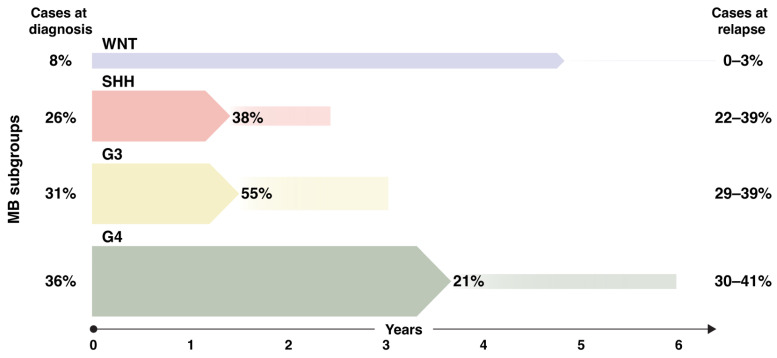
Figure 1.
Relapse frequency depending on medulloblastoma subgroup. Cases at diagnosis represent the percentage of a particular medulloblastoma (MB) subgroup as compared to all MBs. Percentages within the figure represent the relapse fraction for each subgroup. The initial arrow length indicates the time to relapse from diagnosis in years and the smaller arrows with sharp ends represent the time from relapse to death. Data were obtained from [24,25,32] and do not include secondary non-MB relapses. WNT: WNT-activated, SHH: Sonic hedgehog activated, G3: non-WNT/non-SHH Group 3. G4: non-WNT/non-SHH Group 4.

