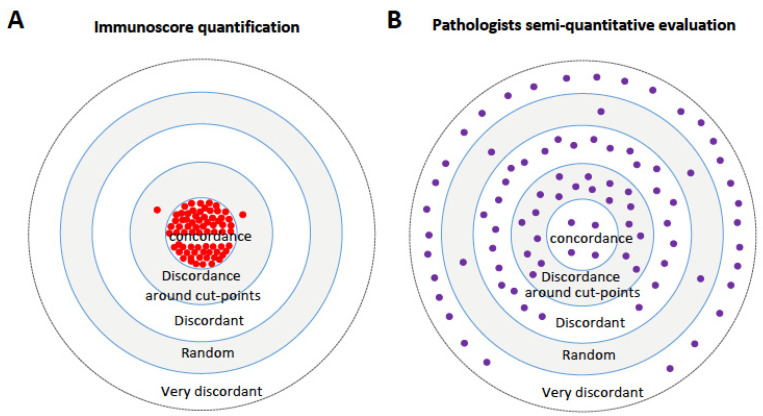
Figure 3.
Target plot visualizations to depict the agreement between pathologists’ visual assessments and IS. These illustrations showcase the proportion of evaluations falling into different categories, including concordant, discordant around cut-points, discordant, very discordant (same case classified either High or Int or Low), and random cases (same case differently classified in 50% of evaluations). (A) IS repeated quantification, (B) the mean score of the pathologists’ evaluation of tumor-infiltrating lymphocytes (TIL) on hematoxylin–eosin (HE) slides and of pathologists’ evaluation of CD3 and CD8 stains before and after training. Each point in each plot represents assessments for four patients. Individual pathologist evaluation was previously published by Willis et al. Cancers 2023. Reprinted/adapted with permission from Ref. [90]. Copyright year, 2023 copyright owner’s J. Galon.

