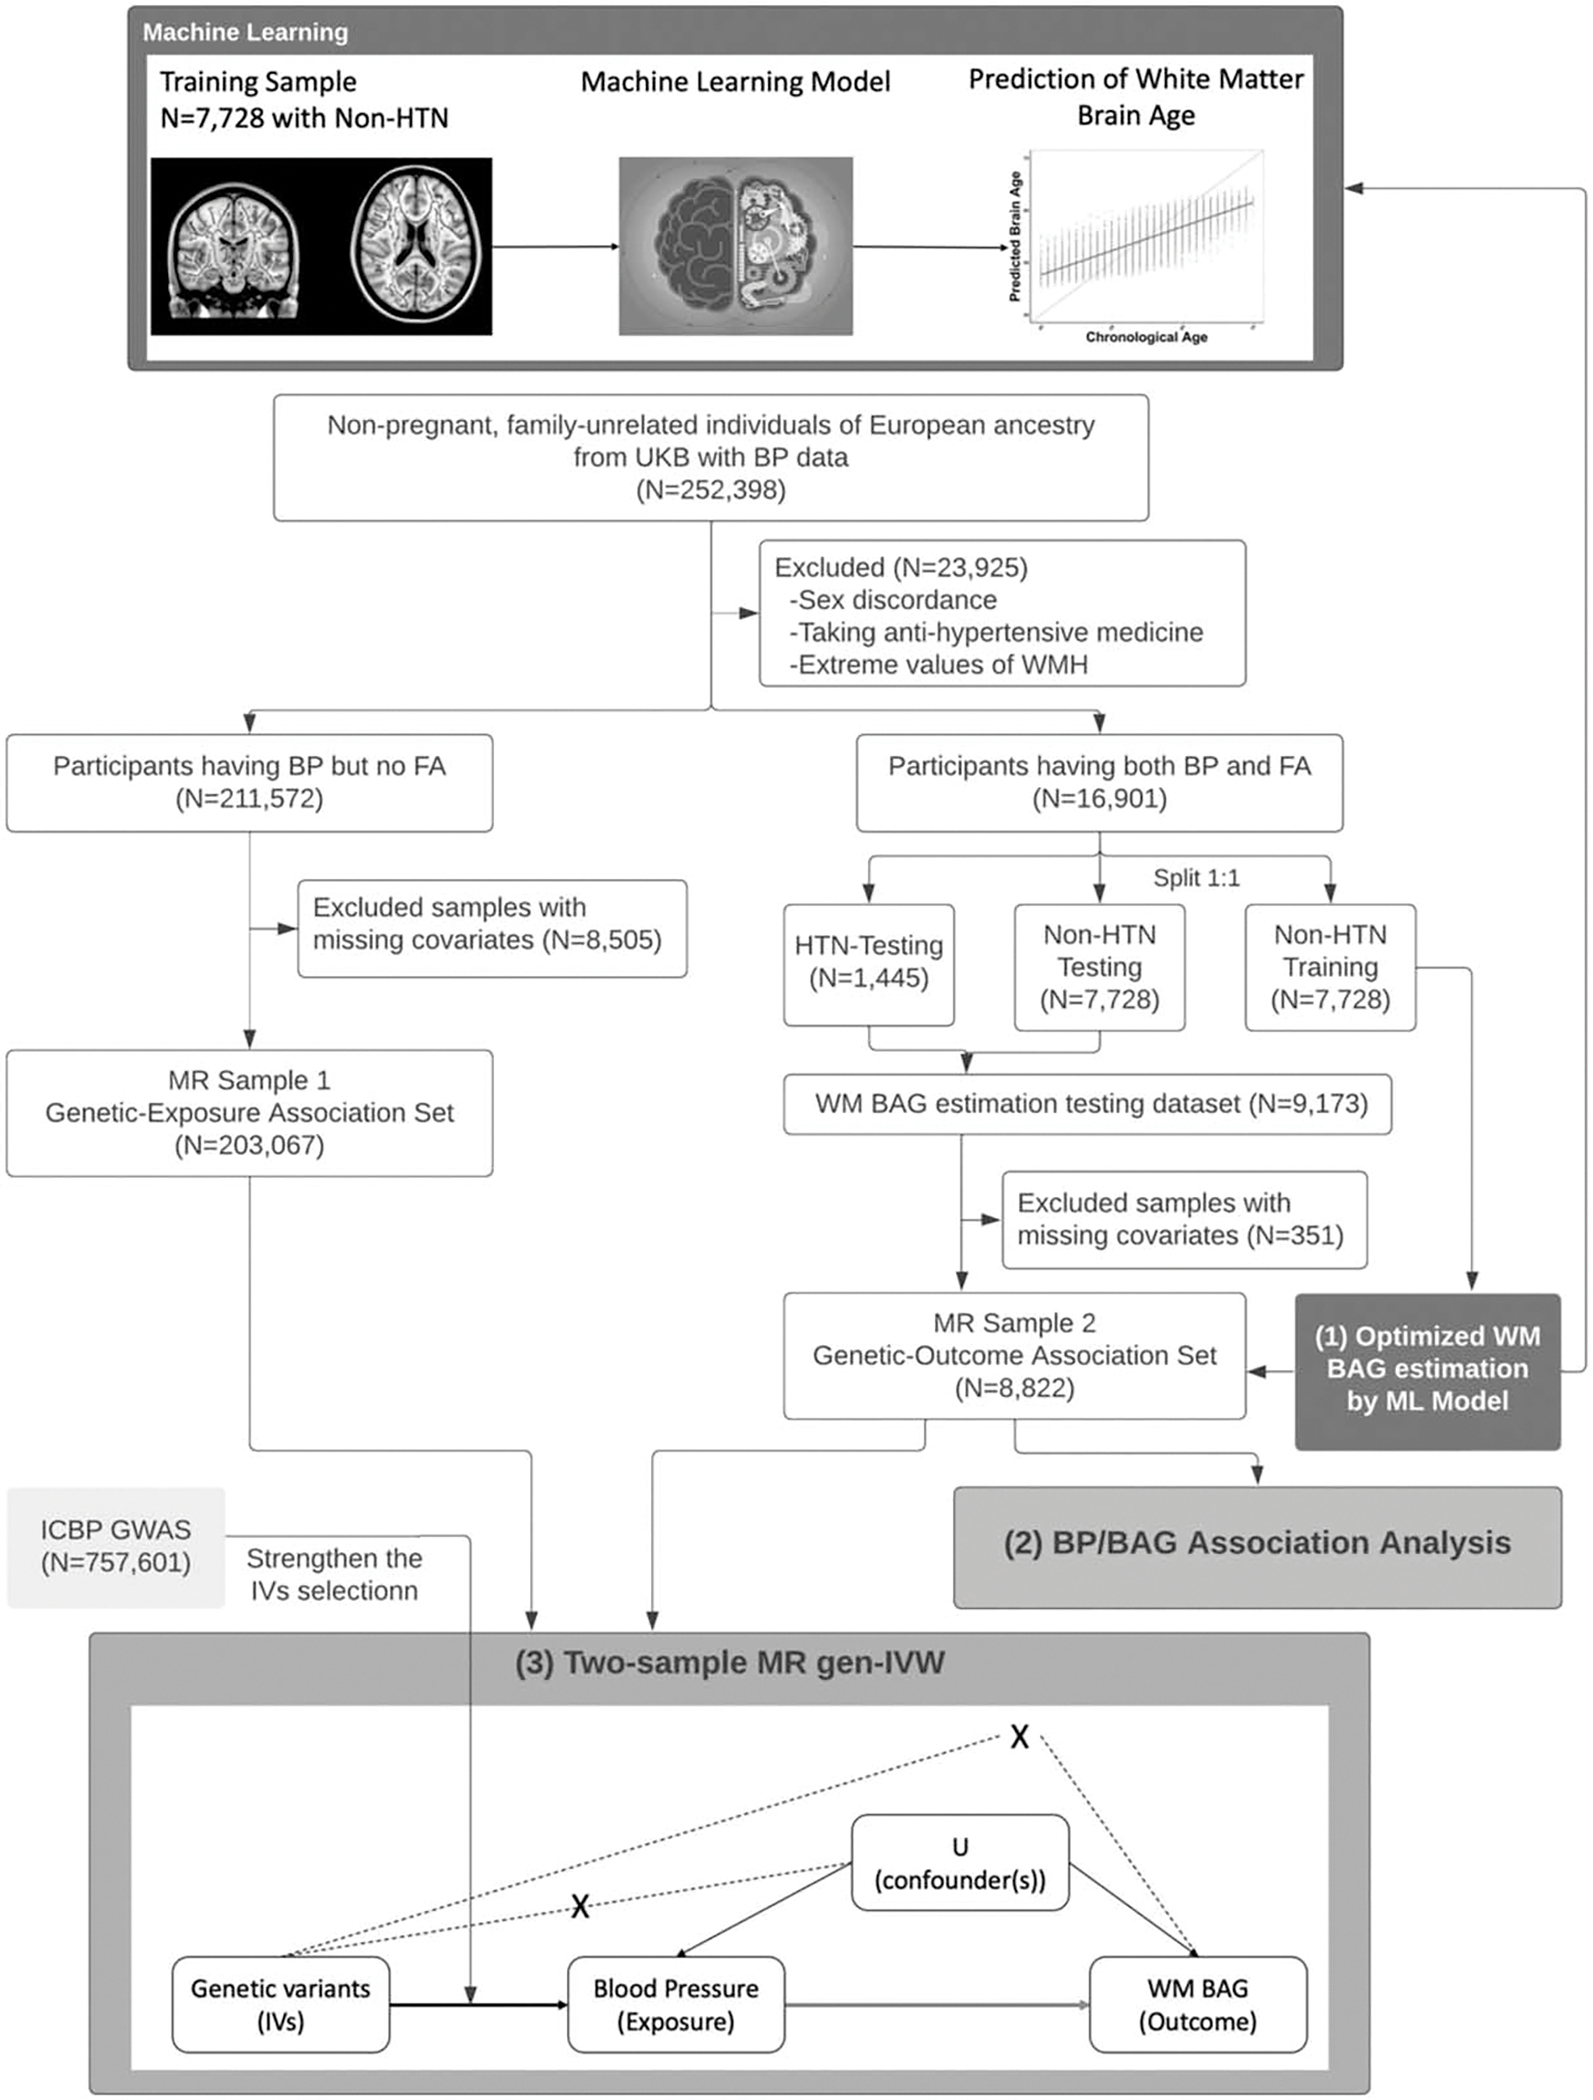
FIGURE 1.

Flowchart of our main analysis procedures and the number of participants included at each step of the analysis. The main analyses are in three parts: estimation of age bias-corrected WM BAG using machine learning model; linear association analysis between BP and BAG; two-sample MR analysis to evaluate causal effect of BP on BAG. In the directed acyclic graph of MR analysis, the solid arrows correspond to the causal relationship, the dashed arrows with cross correspond to the instrumental variables assumptions (ii) and (iii) in MR (see Supplementary Materials section 1.7, http://links.lww.com/HJH/C276), the arrow is the causal relationship of interest in MR model. BAG, brain age gap; BP, blood pressure; MR, Mendelian randomization; WM, white matter.
