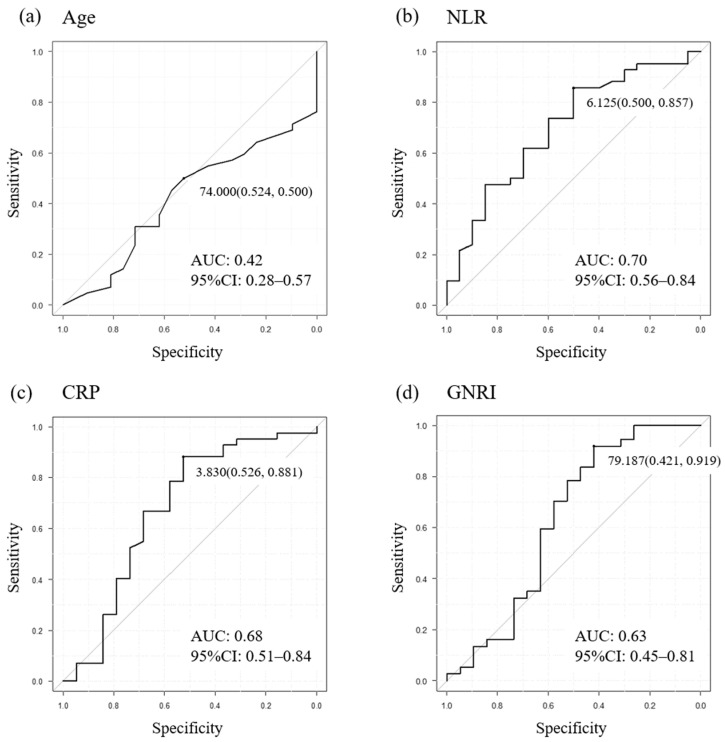
Figure 3.
Setting cut-off values using ROC curve analysis of indicators in the total cohort targeting an objective response to EV. Age (a), NLR (b), CRP (c), and GNRI (d). AUC: Area under the curve, CI: Confidence interval, CRP: C-reactive protein, EV: Enfortumab vedotin, GNRI: Geriatric nutritional risk index, NLR: Neutrophil–lymphocyte ratio, ROC: Receiver operating characteristic.

