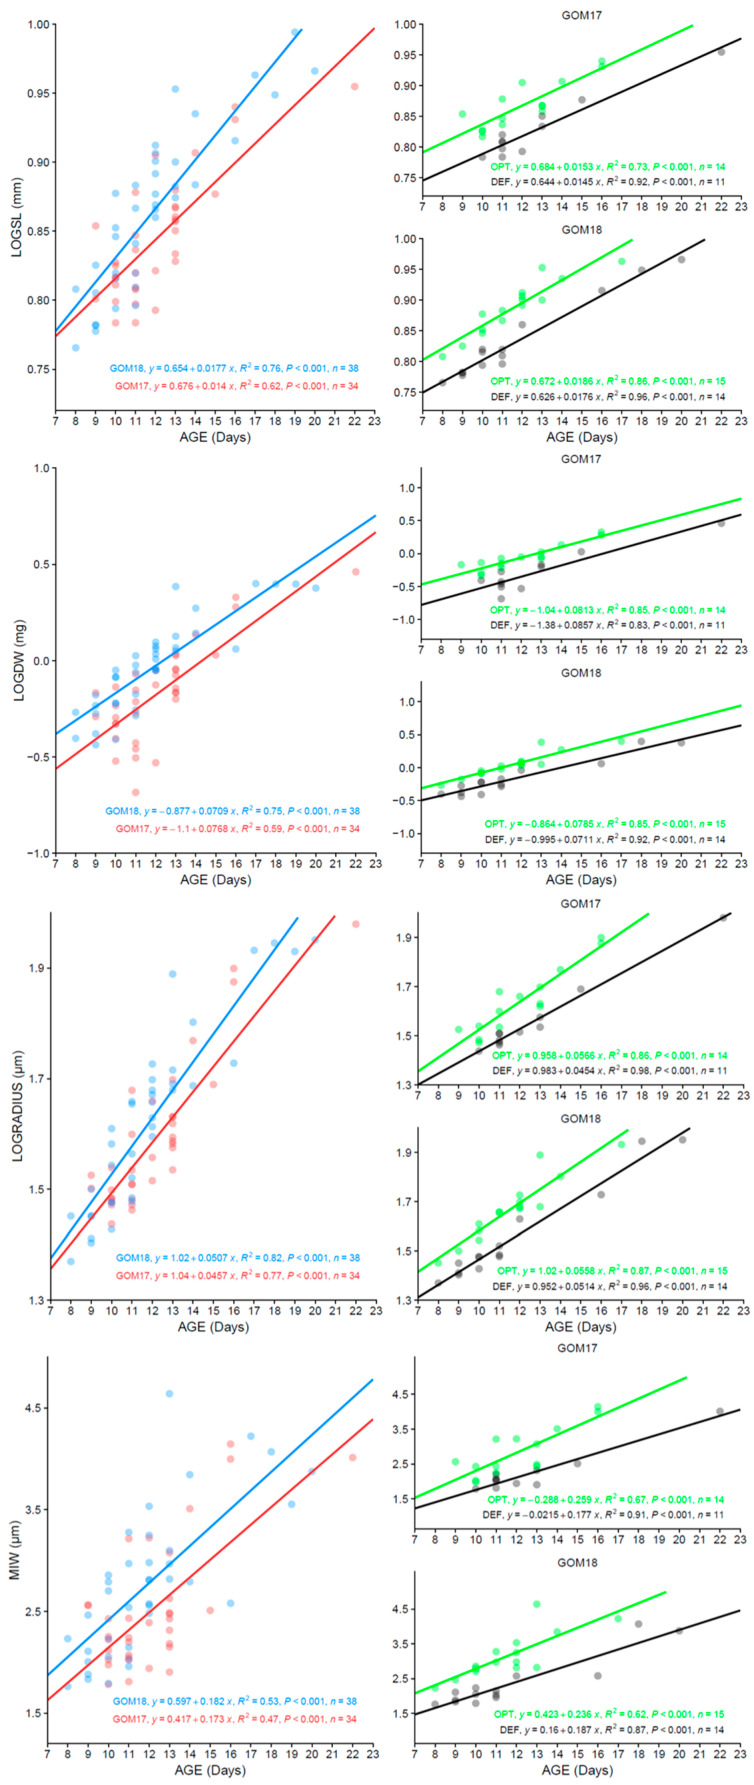
Figure A4.
Comparison of somatic (LOGSL, LOGDW) and otoliths biometric (LOGRADIO, MIW) versus AGE, of post-flexion larvae according to inter-population analysis between years (GOM17 in red, GOM18 in blue) and intra-population (OPT in green, DEF in black). The equations coefficients and R2 are included.

